| Zacks Company Profile for Gorman-Rupp Company (The) (GRC : NYSE) |
|
|
| |
| • Company Description |
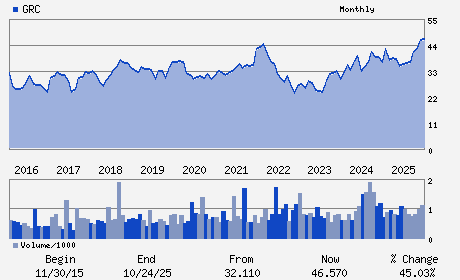
| The Gorman-Rupp Company designs, manufactures and sells pumps and related equipment (pump and motor controls) for use in water, wastewater, construction, industrial, petroleum, original equipment, agricultural, fire protection, military and other liquid-handling applications.
Number of Employees: 1,415 |
|
|
| |
| • Price / Volume Information |
| Yesterday's Closing Price: $62.45 |
Daily Weekly Monthly
 |
| 20 Day Moving Average: 175,187 shares |
| Shares Outstanding: 26.31 (millions) |
| Market Capitalization: $1,643.24 (millions) |
| Beta: 1.27 |
| 52 Week High: $68.02 |
| 52 Week Low: $30.87 |
| Short Interest Ratio: |
| |
% Price Change |
% Price Change Relative to S&P 500 |
| 4 Week |
-3.37% |
3.07% |
| 12 Week |
30.78% |
38.22% |
| Year To Date |
30.78% |
38.22% |
|
|
|
|
| |
|
|
| |
| • General Corporate Information |
Officers
Scott A. King - President;Chief Executive Officer and Director
Jeffrey S. Gorman - Chairman
James C. Kerr - Executive Vice President and Chief Financial Offic
Donald H. Bullock Jr. - Director
M. Ann Harlan - Director
|
|
Peer Information
Gorman-Rupp Company (The) (B.)
Gorman-Rupp Company (The) (DXPE)
Gorman-Rupp Company (The) (AIT)
Gorman-Rupp Company (The) (GDI.)
Gorman-Rupp Company (The) (CTITQ)
Gorman-Rupp Company (The) (EBCOY)
|
|
Industry / Sector / Ticker Info
Analyst Coverage: No
Industry Group: MACH-GENL INDL
Sector: Industrial Products
CUSIP: 383082104
SIC: 3561
|
|
Fiscal Year
Fiscal Year End: December
Last Reported Quarter: 12/01/25
Next Expected EPS Date: 04/23/26
|
|
Share - Related Items
Shares Outstanding: 26.31
Most Recent Split Date: 12.00 (1.25:1)
Beta: 1.27
Market Capitalization: $1,643.24 (millions)
|
|
|
|
|
| |
| • EPS Information |
• Dividend Information |
| Analyst Coverage: No |
Dividend Yield: 1.22% |
| Current Fiscal Quarter EPS Consensus Estimate: $0.49 |
Indicated Annual Dividend: $0.76 |
| Current Fiscal Year EPS Consensus Estimate: $2.32 |
Payout Ratio: 0.36 |
| Number of Estimates in the Fiscal Year Consensus: 1.00 |
Change In Payout Ratio: -0.17 |
| Estmated Long-Term EPS Growth Rate: 13.00% |
Last Dividend Paid: 02/13/2026 - $0.19 |
| Next EPS Report Date: 04/23/26 |
|
|
|
| |