| Zacks Company Profile for H.I.S. Co., Ltd. (HISJF : OTC) |
|
|
| |
| • Company Description |
| H.I.S. Co., Ltd. provides travel agency services. The company offers business trips, group tours and package tours; Skywalker cards and gift cards; overseas travel insurance products. It operates primarily in Australia, Bali Island, Guam, Thailand and South Korea. H.I.S. Co., Ltd. is based in Tokyo, Japan.
Number of Employees: 12,710 |
|
|
| |
| • Price / Volume Information |
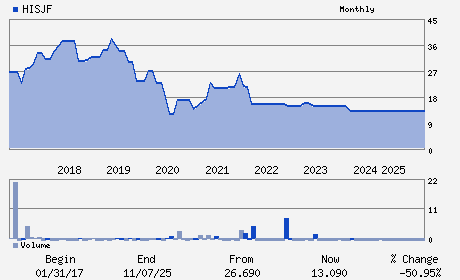
| Yesterday's Closing Price: $13.09 |
Daily Weekly Monthly
 |
| 20 Day Moving Average: 0 shares |
| Shares Outstanding: 74.72 (millions) |
| Market Capitalization: $978.14 (millions) |
| Beta: -0.29 |
| 52 Week High: $ |
| 52 Week Low: $ |
| Short Interest Ratio: |
| |
% Price Change |
% Price Change Relative to S&P 500 |
| 4 Week |
0.00% |
0.87% |
| 12 Week |
0.00% |
-0.12% |
| Year To Date |
0.00% |
-0.49% |
|
|
|
|
| |
| • Address & Contact Information |
| Street Address |
Phone / Fax |
Email Address |
Web URL |
Kamiyacho Trust Tower 5th Floor 4-1-1 Toranomon
-
Tokyo,M0 105-6905
JPN |
ph: 81-50-1746-4188
fax: - |
None |
http://www.his.co.jp |
|
|
| |
| • General Corporate Information |
Officers
Motoshi Yada - President; Chief Executive Officer and Director
Nakamori Tatsuya - Director
Oda Masayuki - Director
Yamanobe Atsushi - Director
Gomi Mutsumi - Director
|
|
Peer Information
H.I.S. Co., Ltd. (KJFI)
H.I.S. Co., Ltd. (MBEW)
H.I.S. Co., Ltd. (DVD)
H.I.S. Co., Ltd. (GCCXQ)
H.I.S. Co., Ltd. (AMIEQ)
H.I.S. Co., Ltd. (FAIR)
|
|
Industry / Sector / Ticker Info
Analyst Coverage: No
Industry Group: LEISURE&REC SVS
Sector: Consumer Discretionary
CUSIP: J20087102
SIC: 4724
|
|
Fiscal Year
Fiscal Year End: October
Last Reported Quarter: 10/01/25
Next Expected EPS Date: 03/30/26
|
|
Share - Related Items
Shares Outstanding: 74.72
Most Recent Split Date: (:1)
Beta: -0.29
Market Capitalization: $978.14 (millions)
|
|
|
|
|
| |
| • EPS Information |
• Dividend Information |
| Analyst Coverage: No |
Dividend Yield: 0.00% |
| Current Fiscal Quarter EPS Consensus Estimate: $ |
Indicated Annual Dividend: $0.00 |
| Current Fiscal Year EPS Consensus Estimate: $ |
Payout Ratio: 0.00 |
| Number of Estimates in the Fiscal Year Consensus: |
Change In Payout Ratio: |
| Estmated Long-Term EPS Growth Rate: % |
Last Dividend Paid: NA - $0.00 |
| Next EPS Report Date: 03/30/26 |
|
|
|
| |