| Zacks Company Profile for Hudson Pacific Properties, Inc. (HPP : NYSE) |
|
|
| |
| • Company Description |
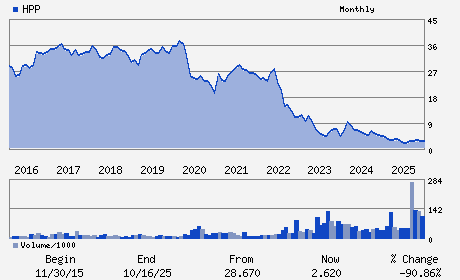
| Hudson Pacific Properties, Inc. is a full-service, vertically integrated real estate company focused on owning, operating and acquiring office properties and media and entertainment properties in select growth markets primarily in Northern and Southern California. These markets include Los Angeles, Orange County, San Diego, San Francisco, Silicon Valley and the East Bay. The Company is headquartered in Los Angeles, California.
Number of Employees: 607 |
|
|
| |
| • Price / Volume Information |
| Yesterday's Closing Price: $6.32 |
Daily Weekly Monthly
 |
| 20 Day Moving Average: 1,386,560 shares |
| Shares Outstanding: 54.24 (millions) |
| Market Capitalization: $342.81 (millions) |
| Beta: 1.50 |
| 52 Week High: $22.89 |
| 52 Week Low: $5.55 |
| Short Interest Ratio: |
| |
% Price Change |
% Price Change Relative to S&P 500 |
| 4 Week |
-3.95% |
-1.99% |
| 12 Week |
-38.40% |
-36.76% |
| Year To Date |
-41.64% |
-40.37% |
|
|
|
|
| |
|
|
| |
| • General Corporate Information |
Officers
Victor J. Coleman - Chief Executive Officer and Chairman of the Boar
Harout K. Diramerian - Chief Financial Officer
Theodore R. Antenucci - Director
Jon Bortz - Director
T. Ritson Ferguson - Director
|
|
Peer Information
Hudson Pacific Properties, Inc. (ARE)
Hudson Pacific Properties, Inc. (CUZ)
Hudson Pacific Properties, Inc. (FUR)
Hudson Pacific Properties, Inc. (NNN)
Hudson Pacific Properties, Inc. (FCH)
Hudson Pacific Properties, Inc. (CTO)
|
|
Industry / Sector / Ticker Info
Analyst Coverage: No
Industry Group: REIT-EQTY TRUST -OTHER
Sector: Finance
CUSIP: 444097406
SIC: 6500
|
|
Fiscal Year
Fiscal Year End: December
Last Reported Quarter: 12/01/25
Next Expected EPS Date: 05/06/26
|
|
Share - Related Items
Shares Outstanding: 54.24
Most Recent Split Date: 12.00 (0.14:1)
Beta: 1.50
Market Capitalization: $342.81 (millions)
|
|
|
|
|
| |
| • EPS Information |
• Dividend Information |
| Analyst Coverage: No |
Dividend Yield: 0.00% |
| Current Fiscal Quarter EPS Consensus Estimate: $0.18 |
Indicated Annual Dividend: $0.00 |
| Current Fiscal Year EPS Consensus Estimate: $0.98 |
Payout Ratio: 0.00 |
| Number of Estimates in the Fiscal Year Consensus: 3.00 |
Change In Payout Ratio: -0.28 |
| Estmated Long-Term EPS Growth Rate: 9.66% |
Last Dividend Paid: NA - $0.00 |
| Next EPS Report Date: 05/06/26 |
|
|
|
| |