| Zacks Company Profile for Harrow, Inc. (HROW : NSDQ) |
|
|
| |
| • Company Description |
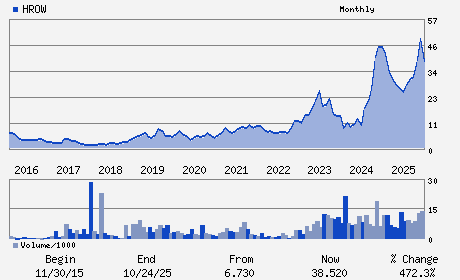
| Harrow Inc. is an eyecare pharmaceutical company. It engaged in the discovery, development, and commercialization of innovative ophthalmic pharmaceutical products principally for the U.S. market. Harrow Inc., formerly known as Harrow Health Inc., is based in NASHVILLE, Tenn.
Number of Employees: 373 |
|
|
| |
| • Price / Volume Information |
| Yesterday's Closing Price: $35.38 |
Daily Weekly Monthly
 |
| 20 Day Moving Average: 1,132,860 shares |
| Shares Outstanding: 37.23 (millions) |
| Market Capitalization: $1,317.19 (millions) |
| Beta: 0.05 |
| 52 Week High: $54.85 |
| 52 Week Low: $20.85 |
| Short Interest Ratio: |
| |
% Price Change |
% Price Change Relative to S&P 500 |
| 4 Week |
-34.47% |
-30.10% |
| 12 Week |
-27.80% |
-23.69% |
| Year To Date |
-27.80% |
-23.69% |
|
|
|
|
| |
| • Address & Contact Information |
| Street Address |
Phone / Fax |
Email Address |
Web URL |
1A Burton Hills Blvd. Suite 200
-
Nashville,TN 37215
USA |
ph: 615-733-4730
fax: 858-345-1745 |
jwebb@harrowinc.com |
http://www.harrow.com |
|
|
| |
| • General Corporate Information |
Officers
Mark L. Baum - Chief Executive Officer and Chairman
Andrew R. Boll - President and Chief Financial Officer
Adrienne L. Graves - Director
Lauren P. Silvernail - Director
Perry J. Sternberg - Director
|
|
Peer Information
Harrow, Inc. (GSAC)
Harrow, Inc. (CASIF)
Harrow, Inc. (ALCD.)
Harrow, Inc. (OMNN)
Harrow, Inc. (CGPI.)
Harrow, Inc. (CATX)
|
|
Industry / Sector / Ticker Info
Analyst Coverage: No
Industry Group: MED-DRUGS
Sector: Medical
CUSIP: 415858109
SIC: 2834
|
|
Fiscal Year
Fiscal Year End: December
Last Reported Quarter: 12/01/25
Next Expected EPS Date: 05/14/26
|
|
Share - Related Items
Shares Outstanding: 37.23
Most Recent Split Date: 2.00 (0.20:1)
Beta: 0.05
Market Capitalization: $1,317.19 (millions)
|
|
|
|
|
| |
| • EPS Information |
• Dividend Information |
| Analyst Coverage: No |
Dividend Yield: 0.00% |
| Current Fiscal Quarter EPS Consensus Estimate: $-0.29 |
Indicated Annual Dividend: $0.00 |
| Current Fiscal Year EPS Consensus Estimate: $0.88 |
Payout Ratio: 0.00 |
| Number of Estimates in the Fiscal Year Consensus: 5.00 |
Change In Payout Ratio: 0.00 |
| Estmated Long-Term EPS Growth Rate: % |
Last Dividend Paid: NA - $0.00 |
| Next EPS Report Date: 05/14/26 |
|
|
|
| |