| Zacks Company Profile for Installed Building Products, Inc. (IBP : NYSE) |
|
|
| |
| • Company Description |
| Installed Building Products, Inc. operates as a residential insulation installer in the United States. The Company also installs complementary building products, including garage doors, rain gutters, shower doors, closet shelving and mirrors. It serves homebuilders, multi-family and commercial builders, individual homeowners, and repair and remodeling contractors. Installed Building Products, Inc. is headquartered in Columbus, Ohio.
Number of Employees: 10,400 |
|
|
| |
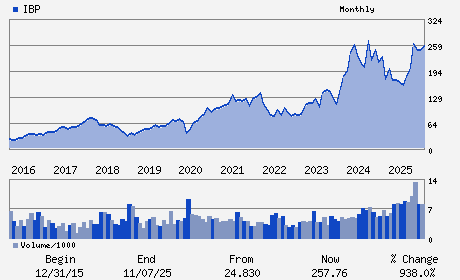
| • Price / Volume Information |
| Yesterday's Closing Price: $277.17 |
Daily Weekly Monthly
 |
| 20 Day Moving Average: 393,554 shares |
| Shares Outstanding: 26.98 (millions) |
| Market Capitalization: $7,476.71 (millions) |
| Beta: 1.90 |
| 52 Week High: $349.00 |
| 52 Week Low: $150.83 |
| Short Interest Ratio: |
| |
% Price Change |
% Price Change Relative to S&P 500 |
| 4 Week |
-15.46% |
-12.19% |
| 12 Week |
4.27% |
9.11% |
| Year To Date |
6.85% |
10.42% |
|
|
|
|
| |
|
|
| |
| • General Corporate Information |
Officers
Jeffrey W. Edwards - Chief Executive Officer; President and
Michael T. Miller - Executive Vice President; Chief Financial Officer
Todd R. Fry - ChiefAccountingOfficerandTreasurer
Margot L. Carter - Director
Lawrence A. Hilsheimer - Director
|
|
Peer Information
Installed Building Products, Inc. (CSRLY)
Installed Building Products, Inc. (ARRD)
Installed Building Products, Inc. (CGMCQ)
Installed Building Products, Inc. (CMCJY)
Installed Building Products, Inc. (OMRP)
Installed Building Products, Inc. (ABLT)
|
|
Industry / Sector / Ticker Info
Analyst Coverage: No
Industry Group: BLDG&CONST-MISC
Sector: Construction
CUSIP: 45780R101
SIC: 1520
|
|
Fiscal Year
Fiscal Year End: December
Last Reported Quarter: 12/01/25
Next Expected EPS Date: 05/14/26
|
|
Share - Related Items
Shares Outstanding: 26.98
Most Recent Split Date: (:1)
Beta: 1.90
Market Capitalization: $7,476.71 (millions)
|
|
|
|
|
| |
| • EPS Information |
• Dividend Information |
| Analyst Coverage: No |
Dividend Yield: 0.56% |
| Current Fiscal Quarter EPS Consensus Estimate: $1.80 |
Indicated Annual Dividend: $1.56 |
| Current Fiscal Year EPS Consensus Estimate: $10.65 |
Payout Ratio: 0.14 |
| Number of Estimates in the Fiscal Year Consensus: 3.00 |
Change In Payout Ratio: -0.03 |
| Estmated Long-Term EPS Growth Rate: 6.68% |
Last Dividend Paid: 03/13/2026 - $2.56 |
| Next EPS Report Date: 05/14/26 |
|
|
|
| |