| Zacks Company Profile for Infineon Technologies AG (IFNNY : OTC) |
|
|
| |
| • Company Description |
| Infineon Technologies designs, produces and sells semiconductors, themicrochips which have enabled the information age, and have led to avast increase in the speed, portability and capabilities of computers anda myriad other electronic devices. Infineon is active in providingapplication-oriented semiconductor solutions for use in sectors such asspeech and data communications, peripherals, wireless communications, automotive and industrial electronics, security and chip cards as well as memory products.
Number of Employees: 57,000 |
|
|
| |
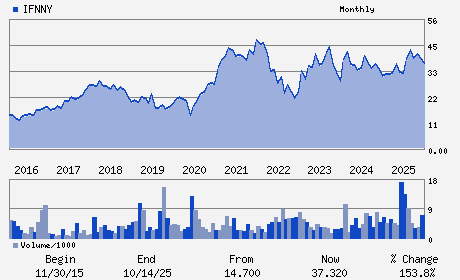
| • Price / Volume Information |
| Yesterday's Closing Price: $45.46 |
Daily Weekly Monthly
 |
| 20 Day Moving Average: 339,177 shares |
| Shares Outstanding: 1,228.50 (millions) |
| Market Capitalization: $55,847.80 (millions) |
| Beta: 1.77 |
| 52 Week High: $56.19 |
| 52 Week Low: $25.80 |
| Short Interest Ratio: |
| |
% Price Change |
% Price Change Relative to S&P 500 |
| 4 Week |
-11.74% |
-9.03% |
| 12 Week |
8.60% |
11.91% |
| Year To Date |
3.37% |
6.69% |
|
|
|
|
| |
|
|
| |
| • General Corporate Information |
Officers
Jochen Hanebeck - Chief Executive Officer
Herbert Diess - Chairman
Rutger Wijburg - Chief Operating Officer
Sven Schneider - Chief Financial Officer
Andreas Urschitz - Chief Marketing Officer
|
|
Peer Information
Infineon Technologies AG (CPCL.)
Infineon Technologies AG (HIFN)
Infineon Technologies AG (SEM.1)
Infineon Technologies AG (DION)
Infineon Technologies AG (AMKR)
Infineon Technologies AG (CNXT.)
|
|
Industry / Sector / Ticker Info
Analyst Coverage: No
Industry Group: ELEC COMP-SEMIC
Sector: Computer and Technology
CUSIP: 45662N103
SIC: 3674
|
|
Fiscal Year
Fiscal Year End: September
Last Reported Quarter: 12/01/25
Next Expected EPS Date: 05/14/26
|
|
Share - Related Items
Shares Outstanding: 1,228.50
Most Recent Split Date: (:1)
Beta: 1.77
Market Capitalization: $55,847.80 (millions)
|
|
|
|
|
| |
| • EPS Information |
• Dividend Information |
| Analyst Coverage: No |
Dividend Yield: 0.61% |
| Current Fiscal Quarter EPS Consensus Estimate: $0.41 |
Indicated Annual Dividend: $0.28 |
| Current Fiscal Year EPS Consensus Estimate: $1.86 |
Payout Ratio: 0.15 |
| Number of Estimates in the Fiscal Year Consensus: 5.00 |
Change In Payout Ratio: 0.03 |
| Estmated Long-Term EPS Growth Rate: 28.25% |
Last Dividend Paid: 02/23/2026 - $0.28 |
| Next EPS Report Date: 05/14/26 |
|
|
|
| |