| Zacks Company Profile for i3 Verticals, Inc. (IIIV : NSDQ) |
|
|
| |
| • Company Description |
| i3 Verticals, Inc. provides payment and software solutions. The Company offers electronic payment services to education, non-profit, public sector, property management and health care industries. i3 Verticals, Inc. is based in TN, United States.
Number of Employees: 1,202 |
|
|
| |
| • Price / Volume Information |
| Yesterday's Closing Price: $22.86 |
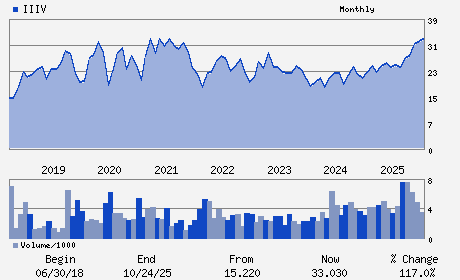
Daily Weekly Monthly
 |
| 20 Day Moving Average: 304,759 shares |
| Shares Outstanding: 30.48 (millions) |
| Market Capitalization: $696.68 (millions) |
| Beta: 0.97 |
| 52 Week High: $33.97 |
| 52 Week Low: $19.89 |
| Short Interest Ratio: |
| |
% Price Change |
% Price Change Relative to S&P 500 |
| 4 Week |
2.74% |
8.26% |
| 12 Week |
-9.25% |
-5.76% |
| Year To Date |
-9.25% |
-5.76% |
|
|
|
|
| |
|
|
| |
| • General Corporate Information |
Officers
Gregory Daily - Chief Executive Officer and Director
Geoff Smith - Chief Financial Officer
Clay Whitson - Chief Strategy Officer and Director
Elizabeth Seigenthaler Courtney - Director
John Harrison - Director
|
|
Peer Information
i3 Verticals, Inc. (ADP)
i3 Verticals, Inc. (CWLD)
i3 Verticals, Inc. (CYBA.)
i3 Verticals, Inc. (ZVLO)
i3 Verticals, Inc. (AZPN)
i3 Verticals, Inc. (ATIS)
|
|
Industry / Sector / Ticker Info
Analyst Coverage: No
Industry Group: INTERNET SOFTWARE
Sector: Computer and Technology
CUSIP: 46571Y107
SIC: 7389
|
|
Fiscal Year
Fiscal Year End: September
Last Reported Quarter: 12/01/25
Next Expected EPS Date: 05/14/26
|
|
Share - Related Items
Shares Outstanding: 30.48
Most Recent Split Date: (:1)
Beta: 0.97
Market Capitalization: $696.68 (millions)
|
|
|
|
|
| |
| • EPS Information |
• Dividend Information |
| Analyst Coverage: No |
Dividend Yield: 0.00% |
| Current Fiscal Quarter EPS Consensus Estimate: $0.19 |
Indicated Annual Dividend: $0.00 |
| Current Fiscal Year EPS Consensus Estimate: $0.68 |
Payout Ratio: 0.00 |
| Number of Estimates in the Fiscal Year Consensus: 3.00 |
Change In Payout Ratio: 0.00 |
| Estmated Long-Term EPS Growth Rate: % |
Last Dividend Paid: NA - $0.00 |
| Next EPS Report Date: 05/14/26 |
|
|
|
| |