| Zacks Company Profile for Imperial Tobacco Group PLC (IMBBY : OTC) |
|
|
| |
| • Company Description |
| Imperial Brands PLC manufactures, markets and sells tobacco and tobacco-related products. It offers cigarettes, fine cut tobacco, papers, cigars, snus and smokeless tobacco products. Imperial Brands PLC, formerly known as Imperial Tobacco Group PLC, is based in Bristol, the United Kingdom.
Number of Employees: 25,100 |
|
|
| |
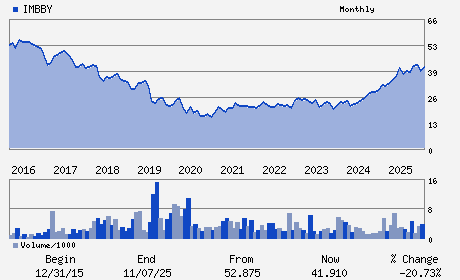
| • Price / Volume Information |
| Yesterday's Closing Price: $44.24 |
Daily Weekly Monthly
 |
| 20 Day Moving Average: 85,381 shares |
| Shares Outstanding: 791.27 (millions) |
| Market Capitalization: $35,004.96 (millions) |
| Beta: 0.36 |
| 52 Week High: $45.60 |
| 52 Week Low: $34.62 |
| Short Interest Ratio: |
| |
% Price Change |
% Price Change Relative to S&P 500 |
| 4 Week |
4.60% |
6.04% |
| 12 Week |
2.07% |
1.55% |
| Year To Date |
5.31% |
4.75% |
|
|
|
|
| |
|
|
| |
| • General Corporate Information |
Officers
Lukas Paravicini - Chief Executive Officer
Therese Esperdy - Chairman
Murray McGowan - Chief Financial Officer
Andrew Gilchrist - Director
Julie Hamilton - Director
|
|
Peer Information
Imperial Tobacco Group PLC (SOZCF)
Imperial Tobacco Group PLC (ISPR)
Imperial Tobacco Group PLC (CIGR)
Imperial Tobacco Group PLC (STW.)
Imperial Tobacco Group PLC (SWMA.)
Imperial Tobacco Group PLC (UST.)
|
|
Industry / Sector / Ticker Info
Analyst Coverage: No
Industry Group: TOBACCO
Sector: Consumer Staples
CUSIP: 45262P102
SIC: 2100
|
|
Fiscal Year
Fiscal Year End: September
Last Reported Quarter: -
Next Expected EPS Date: -
|
|
Share - Related Items
Shares Outstanding: 791.27
Most Recent Split Date: 7.00 (2.00:1)
Beta: 0.36
Market Capitalization: $35,004.96 (millions)
|
|
|
|
|
| |
| • EPS Information |
• Dividend Information |
| Analyst Coverage: No |
Dividend Yield: 4.79% |
| Current Fiscal Quarter EPS Consensus Estimate: $ |
Indicated Annual Dividend: $2.12 |
| Current Fiscal Year EPS Consensus Estimate: $4.53 |
Payout Ratio: |
| Number of Estimates in the Fiscal Year Consensus: 2.00 |
Change In Payout Ratio: |
| Estmated Long-Term EPS Growth Rate: 9.50% |
Last Dividend Paid: 02/20/2026 - $0.53 |
| Next EPS Report Date: - |
|
|
|
| |