| Zacks Company Profile for indie Semiconductor, Inc. (INDI : NSDQ) |
|
|
| |
| • Company Description |
| indie Semiconductor provides automotive semiconductors and software platforms. It focus on edge sensors for Advanced Driver Assistance Systems including LiDAR, connected car, user experience and electrification applications. indie Semiconductor, formerly known as Thunder Bridge Acquisition II Ltd., is based in Virginia, United States.
Number of Employees: 800 |
|
|
| |
| • Price / Volume Information |
| Yesterday's Closing Price: $2.56 |
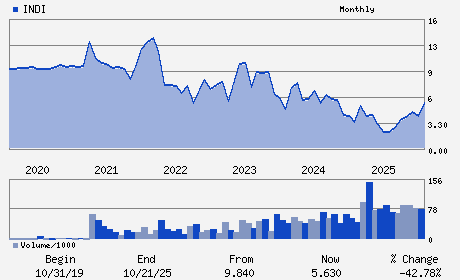
Daily Weekly Monthly
 |
| 20 Day Moving Average: 6,791,053 shares |
| Shares Outstanding: 223.66 (millions) |
| Market Capitalization: $572.57 (millions) |
| Beta: 2.55 |
| 52 Week High: $6.05 |
| 52 Week Low: $1.53 |
| Short Interest Ratio: |
| |
% Price Change |
% Price Change Relative to S&P 500 |
| 4 Week |
-29.48% |
-25.11% |
| 12 Week |
-31.55% |
-27.10% |
| Year To Date |
-27.48% |
-23.70% |
|
|
|
|
| |
| • Address & Contact Information |
| Street Address |
Phone / Fax |
Email Address |
Web URL |
32 Journey
-
Aliso Viejo,CA 92656
USA |
ph: 949-608-0854
fax: - |
ir@indie.inc |
http://www.indie.inc |
|
|
| |
| • General Corporate Information |
Officers
Donald McClymont - Chief Executive Officer and Director
David Aldrich - Chairman of the Board of Directors
Ichiro Aoki - President and Director
Naixi Wu - Chief Financial Officer
Diane Biagianti - Director
|
|
Peer Information
indie Semiconductor, Inc. (CPCL.)
indie Semiconductor, Inc. (HIFN)
indie Semiconductor, Inc. (SEM.1)
indie Semiconductor, Inc. (DION)
indie Semiconductor, Inc. (AMKR)
indie Semiconductor, Inc. (CNXT.)
|
|
Industry / Sector / Ticker Info
Analyst Coverage: No
Industry Group: ELEC COMP-SEMIC
Sector: Computer and Technology
CUSIP: 45569U101
SIC: 3674
|
|
Fiscal Year
Fiscal Year End: December
Last Reported Quarter: 12/01/25
Next Expected EPS Date: 05/11/26
|
|
Share - Related Items
Shares Outstanding: 223.66
Most Recent Split Date: (:1)
Beta: 2.55
Market Capitalization: $572.57 (millions)
|
|
|
|
|
| |
| • EPS Information |
• Dividend Information |
| Analyst Coverage: No |
Dividend Yield: 0.00% |
| Current Fiscal Quarter EPS Consensus Estimate: $-0.14 |
Indicated Annual Dividend: $0.00 |
| Current Fiscal Year EPS Consensus Estimate: $-0.44 |
Payout Ratio: |
| Number of Estimates in the Fiscal Year Consensus: 3.00 |
Change In Payout Ratio: |
| Estmated Long-Term EPS Growth Rate: % |
Last Dividend Paid: NA - $0.00 |
| Next EPS Report Date: 05/11/26 |
|
|
|
| |