| Zacks Company Profile for J.B. Hunt Transport Services, Inc. (JBHT : NSDQ) |
|
|
| |
| • Company Description |
| J.B. Hunt Transport Services is a provider of a broad range of transportation services to a diverse group of customers through the United States, Canada and Mexico. J.B. Hunt services include intermodal, dedicated, refrigerated, truckload, less-than-truckload, flatbed, single source, final mile, and more.
Number of Employees: 31,750 |
|
|
| |
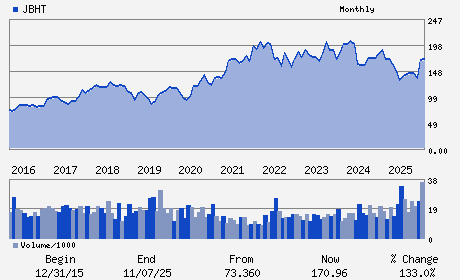
| • Price / Volume Information |
| Yesterday's Closing Price: $233.41 |
Daily Weekly Monthly
 |
| 20 Day Moving Average: 1,100,435 shares |
| Shares Outstanding: 94.60 (millions) |
| Market Capitalization: $22,081.54 (millions) |
| Beta: 1.23 |
| 52 Week High: $234.82 |
| 52 Week Low: $122.79 |
| Short Interest Ratio: |
| |
% Price Change |
% Price Change Relative to S&P 500 |
| 4 Week |
15.14% |
16.15% |
| 12 Week |
23.88% |
23.73% |
| Year To Date |
20.10% |
19.52% |
|
|
|
|
| |
|
|
| |
| • General Corporate Information |
Officers
Shelley Simpson - Chief Executive Officer and President
John N. Roberts - Executive Chairman
A. Brad Delco - Chief Financial Officer and Executive Vice Preside
John Kuhlow - Senior Vice President and Chief Accounting Officer
James L. Robo - Directors
|
|
Peer Information
J.B. Hunt Transport Services, Inc. (DMSC)
J.B. Hunt Transport Services, Inc. (CVLG)
J.B. Hunt Transport Services, Inc. (IRNE)
J.B. Hunt Transport Services, Inc. (CDV)
J.B. Hunt Transport Services, Inc. (ARCB)
J.B. Hunt Transport Services, Inc. (CEXP)
|
|
Industry / Sector / Ticker Info
Analyst Coverage: No
Industry Group: TRANS-TRUCK
Sector: Transportation
CUSIP: 445658107
SIC: 4213
|
|
Fiscal Year
Fiscal Year End: December
Last Reported Quarter: 12/01/25
Next Expected EPS Date: 04/21/26
|
|
Share - Related Items
Shares Outstanding: 94.60
Most Recent Split Date: 5.00 (2.00:1)
Beta: 1.23
Market Capitalization: $22,081.54 (millions)
|
|
|
|
|
| |
| • EPS Information |
• Dividend Information |
| Analyst Coverage: No |
Dividend Yield: 0.77% |
| Current Fiscal Quarter EPS Consensus Estimate: $1.46 |
Indicated Annual Dividend: $1.80 |
| Current Fiscal Year EPS Consensus Estimate: $7.15 |
Payout Ratio: 0.29 |
| Number of Estimates in the Fiscal Year Consensus: 11.00 |
Change In Payout Ratio: 0.05 |
| Estmated Long-Term EPS Growth Rate: 17.22% |
Last Dividend Paid: 02/06/2026 - $0.45 |
| Next EPS Report Date: 04/21/26 |
|
|
|
| |