| Zacks Company Profile for Kumba Iron Ore Ltd. (KIROY : OTC) |
|
|
| |
| • Company Description |
| Kumba Iron Ore Limited engages in the exploration, extraction, beneficiation, marketing, shipping, and sale of iron ore in South Africa. Its mining assets and natural resources also include platinum group metals and diamonds, copper, iron ore, metallurgical coal, nickel and thermal coal. The company has mines in various places like Thabazimbi in Limpopo, Sishen in Northern Cape; and Kolomela mine. It also transports iron ore to its customers in Europe and Asia. Kumba Iron Ore Limited is headquartered in Centurion, South Africa.
Number of Employees: |
|
|
| |
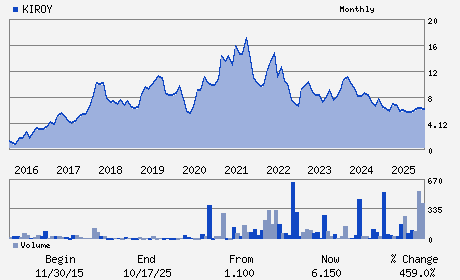
| • Price / Volume Information |
| Yesterday's Closing Price: $5.95 |
Daily Weekly Monthly
 |
| 20 Day Moving Average: 4,770 shares |
| Shares Outstanding: 963.57 (millions) |
| Market Capitalization: $5,733.25 (millions) |
| Beta: 0.97 |
| 52 Week High: $8.47 |
| 52 Week Low: $4.78 |
| Short Interest Ratio: |
| |
% Price Change |
% Price Change Relative to S&P 500 |
| 4 Week |
-21.92% |
-17.65% |
| 12 Week |
-14.63% |
-9.05% |
| Year To Date |
-16.67% |
-10.17% |
|
|
|
|
| |
|
|
| |
| • General Corporate Information |
Officers
Nompumelelo D. Zikalala - Chief Executive Officer and Executive Director
TP Goodlace - Chairperson
Vijay Kumar - Chief Operating Officer
Bothwell Anesu Mazarura - Chief Financial Officer and Executive Director
Fazila Patel - Company Secretary
|
|
Peer Information
Kumba Iron Ore Ltd. (VALE)
Kumba Iron Ore Ltd. (GNI)
Kumba Iron Ore Ltd. (T.LIM)
Kumba Iron Ore Ltd. (MSB)
Kumba Iron Ore Ltd. (T.CLM)
Kumba Iron Ore Ltd. (VPRD)
|
|
Industry / Sector / Ticker Info
Analyst Coverage: No
Industry Group: MINING -IRON
Sector: Basic Materials
CUSIP: 50125N104
SIC: 8880
|
|
Fiscal Year
Fiscal Year End: December
Last Reported Quarter: -
Next Expected EPS Date: -
|
|
Share - Related Items
Shares Outstanding: 963.57
Most Recent Split Date: 7.00 (3.00:1)
Beta: 0.97
Market Capitalization: $5,733.25 (millions)
|
|
|
|
|
| |
| • EPS Information |
• Dividend Information |
| Analyst Coverage: No |
Dividend Yield: 7.54% |
| Current Fiscal Quarter EPS Consensus Estimate: $ |
Indicated Annual Dividend: $0.45 |
| Current Fiscal Year EPS Consensus Estimate: $ |
Payout Ratio: |
| Number of Estimates in the Fiscal Year Consensus: |
Change In Payout Ratio: |
| Estmated Long-Term EPS Growth Rate: % |
Last Dividend Paid: 03/13/2026 - $0.24 |
| Next EPS Report Date: - |
|
|
|
| |