| Zacks Company Profile for Keros Therapeutics, Inc. (KROS : NSDQ) |
|
|
| |
| • Company Description |
| Keros Therapeutics, Inc. is a clinical-stage biopharmaceutical company. It is focused on the discovery, development and commercialization of novel treatments for hematological and musculoskeletal disorders. The company's product pipeline consists of KER-050, KER-047and KER-012 which are in clinical stage. Keros Therapeutics, Inc. is based in LEXINGTON, MA.
Number of Employees: 78 |
|
|
| |
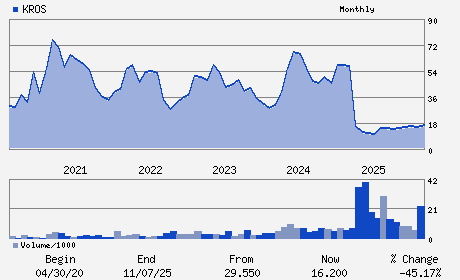
| • Price / Volume Information |
| Yesterday's Closing Price: $11.34 |
Daily Weekly Monthly
 |
| 20 Day Moving Average: 583,087 shares |
| Shares Outstanding: 19.72 (millions) |
| Market Capitalization: $223.60 (millions) |
| Beta: 0.87 |
| 52 Week High: $22.55 |
| 52 Week Low: $9.12 |
| Short Interest Ratio: |
| |
% Price Change |
% Price Change Relative to S&P 500 |
| 4 Week |
-25.49% |
-21.49% |
| 12 Week |
-44.30% |
-42.16% |
| Year To Date |
-44.30% |
-42.16% |
|
|
|
|
| |
|
|
| |
| • General Corporate Information |
Officers
Jasbir Seehra - Chief Executive Officer
Jean-Jacques Bienaime - Chairman
Keith Regnante - Chief Financial Officer
Nima Farzan - Director
Carl Gordon - Director
|
|
Peer Information
Keros Therapeutics, Inc. (CORR.)
Keros Therapeutics, Inc. (RSPI)
Keros Therapeutics, Inc. (CGXP)
Keros Therapeutics, Inc. (BGEN)
Keros Therapeutics, Inc. (GTBP)
Keros Therapeutics, Inc. (RGRX)
|
|
Industry / Sector / Ticker Info
Analyst Coverage: No
Industry Group: MED-BIOMED/GENE
Sector: Medical
CUSIP: 492327101
SIC: 2834
|
|
Fiscal Year
Fiscal Year End: December
Last Reported Quarter: 12/01/25
Next Expected EPS Date: 05/05/26
|
|
Share - Related Items
Shares Outstanding: 19.72
Most Recent Split Date: (:1)
Beta: 0.87
Market Capitalization: $223.60 (millions)
|
|
|
|
|
| |
| • EPS Information |
• Dividend Information |
| Analyst Coverage: No |
Dividend Yield: 0.00% |
| Current Fiscal Quarter EPS Consensus Estimate: $-1.02 |
Indicated Annual Dividend: $0.00 |
| Current Fiscal Year EPS Consensus Estimate: $-4.99 |
Payout Ratio: 0.00 |
| Number of Estimates in the Fiscal Year Consensus: 8.00 |
Change In Payout Ratio: |
| Estmated Long-Term EPS Growth Rate: 36.50% |
Last Dividend Paid: NA - $0.00 |
| Next EPS Report Date: 05/05/26 |
|
|
|
| |