| Zacks Company Profile for Kura Oncology, Inc. (KURA : NSDQ) |
|
|
| |
| • Company Description |
| Kura Oncology, Inc. is a biopharmaceutical company. The company is involved in the discovery and development of therapeutics for the treatment of tumors and blood cancers. Its product pipeline includes small molecule drug candidates which are in different clinical trial consists of Tipifarnib-HRAS, Tipifarnib-PTCL, ERK inhibitor program and Menin MLL inhibitor program. Kura Oncology, Inc. is headquartered in La Jolla, California.
Number of Employees: 260 |
|
|
| |
| • Price / Volume Information |
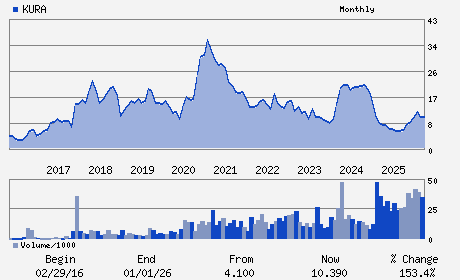
| Yesterday's Closing Price: $8.26 |
Daily Weekly Monthly
 |
| 20 Day Moving Average: 1,593,436 shares |
| Shares Outstanding: 88.33 (millions) |
| Market Capitalization: $729.60 (millions) |
| Beta: 0.22 |
| 52 Week High: $12.49 |
| 52 Week Low: $5.41 |
| Short Interest Ratio: |
| |
% Price Change |
% Price Change Relative to S&P 500 |
| 4 Week |
-2.36% |
3.68% |
| 12 Week |
-22.30% |
-17.24% |
| Year To Date |
-20.50% |
-16.36% |
|
|
|
|
| |
|
|
| |
| • General Corporate Information |
Officers
Troy E. Wilson - President; Chief Executive Officer and Chairman
Thomas Doyle - Senior Vice President; Finance & Accounting
Helen Collins - Director
Faheem Hasnain - Director
Thomas Malley - Director
|
|
Peer Information
Kura Oncology, Inc. (CORR.)
Kura Oncology, Inc. (RSPI)
Kura Oncology, Inc. (CGXP)
Kura Oncology, Inc. (BGEN)
Kura Oncology, Inc. (GTBP)
Kura Oncology, Inc. (RGRX)
|
|
Industry / Sector / Ticker Info
Analyst Coverage: No
Industry Group: MED-BIOMED/GENE
Sector: Medical
CUSIP: 50127T109
SIC: 2834
|
|
Fiscal Year
Fiscal Year End: December
Last Reported Quarter: 12/01/25
Next Expected EPS Date: 05/07/26
|
|
Share - Related Items
Shares Outstanding: 88.33
Most Recent Split Date: (:1)
Beta: 0.22
Market Capitalization: $729.60 (millions)
|
|
|
|
|
| |
| • EPS Information |
• Dividend Information |
| Analyst Coverage: No |
Dividend Yield: 0.00% |
| Current Fiscal Quarter EPS Consensus Estimate: $-0.89 |
Indicated Annual Dividend: $0.00 |
| Current Fiscal Year EPS Consensus Estimate: $-3.28 |
Payout Ratio: |
| Number of Estimates in the Fiscal Year Consensus: 8.00 |
Change In Payout Ratio: |
| Estmated Long-Term EPS Growth Rate: % |
Last Dividend Paid: NA - $0.00 |
| Next EPS Report Date: 05/07/26 |
|
|
|
| |