| Zacks Company Profile for Kyocera Corporation (KYOCY : OTC) |
|
|
| |
| • Company Description |
| Kyocera Corporation was founded in 1959 as a company specializing in the production of fine ceramic components, Kyocera has expanded its business byeffectively developing and applying its ceramics technologies. The company has grown to be a world-leading manufacturer of ceramics, including custom parts and consumer products. Kyocera's materials, components, and finished products are used in virtually all fields of industry. In addition to ceramics, products also include information, tele-communications, and Optical equipment.
Number of Employees: 77,136 |
|
|
| |
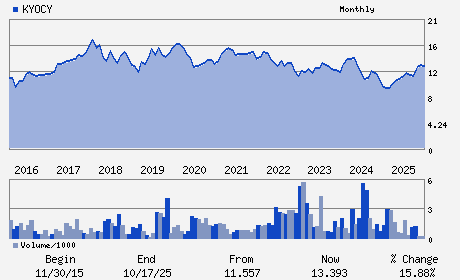
| • Price / Volume Information |
| Yesterday's Closing Price: $15.52 |
Daily Weekly Monthly
 |
| 20 Day Moving Average: 41,975 shares |
| Shares Outstanding: 1,408.64 (millions) |
| Market Capitalization: $21,862.13 (millions) |
| Beta: 0.27 |
| 52 Week High: $18.10 |
| 52 Week Low: $10.35 |
| Short Interest Ratio: |
| |
% Price Change |
% Price Change Relative to S&P 500 |
| 4 Week |
-9.66% |
-6.16% |
| 12 Week |
10.46% |
15.59% |
| Year To Date |
9.60% |
13.26% |
|
|
|
|
| |
|
|
| |
| • General Corporate Information |
Officers
GoroYamaguchi - Chairman
HideoTanimoto - President
Hiroshi Fure - Director
NorihikoIna - Director
Koichi Kano - Director
|
|
Peer Information
Kyocera Corporation (SMTI.)
Kyocera Corporation (DDICQ)
Kyocera Corporation (CGGIQ)
Kyocera Corporation (CRDN)
Kyocera Corporation (CDTS)
Kyocera Corporation (AURAQ)
|
|
Industry / Sector / Ticker Info
Analyst Coverage: No
Industry Group: ELEC-MISC COMPONENTS
Sector: Computer and Technology
CUSIP: 501556203
SIC: 3674
|
|
Fiscal Year
Fiscal Year End: March
Last Reported Quarter: 12/01/25
Next Expected EPS Date: 05/13/26
|
|
Share - Related Items
Shares Outstanding: 1,408.64
Most Recent Split Date: 1.00 (4.00:1)
Beta: 0.27
Market Capitalization: $21,862.13 (millions)
|
|
|
|
|
| |
| • EPS Information |
• Dividend Information |
| Analyst Coverage: No |
Dividend Yield: 1.65% |
| Current Fiscal Quarter EPS Consensus Estimate: $0.06 |
Indicated Annual Dividend: $0.26 |
| Current Fiscal Year EPS Consensus Estimate: $0.58 |
Payout Ratio: 0.51 |
| Number of Estimates in the Fiscal Year Consensus: 1.00 |
Change In Payout Ratio: -0.29 |
| Estmated Long-Term EPS Growth Rate: % |
Last Dividend Paid: NA - $0.00 |
| Next EPS Report Date: 05/13/26 |
|
|
|
| |