| Zacks Company Profile for Linde PLC (LIN : NSDQ) |
|
|
| |
| • Company Description |
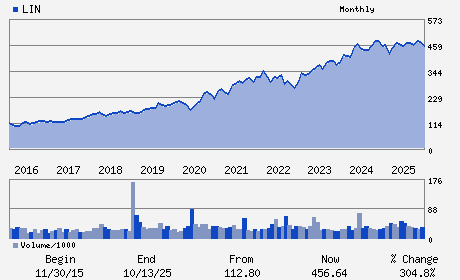
| New Linde plc. is an industrial gases and engineering company. It serves chemicals & energy, food & beverage, electronics, healthcare, manufacturing, metals and mining market. New Linde plc., formerly known as LINDE PLC, is based in WOKING, UK.
Number of Employees: 65,177 |
|
|
| |
| • Price / Volume Information |
| Yesterday's Closing Price: $510.75 |
Daily Weekly Monthly
 |
| 20 Day Moving Average: 1,818,269 shares |
| Shares Outstanding: 463.39 (millions) |
| Market Capitalization: $236,678.55 (millions) |
| Beta: 0.78 |
| 52 Week High: $513.94 |
| 52 Week Low: $387.78 |
| Short Interest Ratio: |
| |
% Price Change |
% Price Change Relative to S&P 500 |
| 4 Week |
2.30% |
-9.54% |
| 12 Week |
10.99% |
7.94% |
| Year To Date |
19.78% |
14.30% |
|
|
|
|
| |
|
|
| |
| • General Corporate Information |
Officers
Sanjiv Lamba - Chairman and Chief Executive Officer
Matthew J. White - Chief Financial Officer
Kelcey E. Hoyt - Chief Accounting Officer
Ann-Kristin Achleitner - Director
Robert L. Wood - Director
|
|
Peer Information
Linde PLC (CSBHY)
Linde PLC (ARWM)
Linde PLC (FUL)
Linde PLC (IAX)
Linde PLC (AVD)
Linde PLC (ASH)
|
|
Industry / Sector / Ticker Info
Analyst Coverage: No
Industry Group: CHEM-SPECIALTY
Sector: Basic Materials
CUSIP: G54950103
SIC: 2810
|
|
Fiscal Year
Fiscal Year End: December
Last Reported Quarter: 12/01/25
Next Expected EPS Date: 05/01/26
|
|
Share - Related Items
Shares Outstanding: 463.39
Most Recent Split Date: 12.00 (2.00:1)
Beta: 0.78
Market Capitalization: $236,678.55 (millions)
|
|
|
|
|
| |
| • EPS Information |
• Dividend Information |
| Analyst Coverage: No |
Dividend Yield: 1.25% |
| Current Fiscal Quarter EPS Consensus Estimate: $4.44 |
Indicated Annual Dividend: $6.40 |
| Current Fiscal Year EPS Consensus Estimate: $17.81 |
Payout Ratio: 0.36 |
| Number of Estimates in the Fiscal Year Consensus: 9.00 |
Change In Payout Ratio: -0.03 |
| Estmated Long-Term EPS Growth Rate: 8.91% |
Last Dividend Paid: 03/11/2026 - $1.60 |
| Next EPS Report Date: 05/01/26 |
|
|
|
| |