| Zacks Company Profile for Landstar System, Inc. (LSTR : NSDQ) |
|
|
| |
| • Company Description |
| Landstar System, Inc. is an asset-light provider of integrated transportation management solutions. The company provides services throughout the United States, Canada, Mexico as well as other countries in North America. Landstar operates primarily through two segments: the transportation logistics segment and the insurance segment.
Number of Employees: 1,378 |
|
|
| |
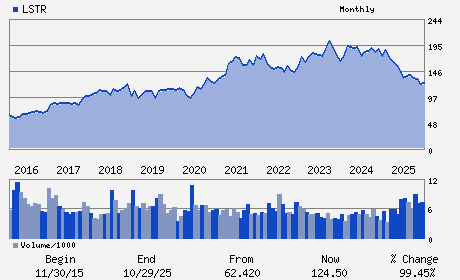
| • Price / Volume Information |
| Yesterday's Closing Price: $156.52 |
Daily Weekly Monthly
 |
| 20 Day Moving Average: 462,223 shares |
| Shares Outstanding: 33.97 (millions) |
| Market Capitalization: $5,316.53 (millions) |
| Beta: 0.81 |
| 52 Week High: $166.11 |
| 52 Week Low: $119.32 |
| Short Interest Ratio: |
| |
% Price Change |
% Price Change Relative to S&P 500 |
| 4 Week |
-3.95% |
3.75% |
| 12 Week |
6.64% |
14.83% |
| Year To Date |
8.92% |
17.07% |
|
|
|
|
| |
|
|
| |
| • General Corporate Information |
Officers
Frank A. Lonegro - President and Chief Executive Officer
Diana M. Murphy - Chairman of the Board
James P. Todd - Chief Financial Officer and Vice President
Homaira Akbari - Director
David G. Bannister - Director
|
|
Peer Information
Landstar System, Inc. (DMSC)
Landstar System, Inc. (CVLG)
Landstar System, Inc. (IRNE)
Landstar System, Inc. (CDV)
Landstar System, Inc. (ARCB)
Landstar System, Inc. (CEXP)
|
|
Industry / Sector / Ticker Info
Analyst Coverage: No
Industry Group: TRANS-TRUCK
Sector: Transportation
CUSIP: 515098101
SIC: 4213
|
|
Fiscal Year
Fiscal Year End: December
Last Reported Quarter: 12/01/25
Next Expected EPS Date: 05/12/26
|
|
Share - Related Items
Shares Outstanding: 33.97
Most Recent Split Date: 1.00 (2.00:1)
Beta: 0.81
Market Capitalization: $5,316.53 (millions)
|
|
|
|
|
| |
| • EPS Information |
• Dividend Information |
| Analyst Coverage: No |
Dividend Yield: 1.02% |
| Current Fiscal Quarter EPS Consensus Estimate: $1.10 |
Indicated Annual Dividend: $1.60 |
| Current Fiscal Year EPS Consensus Estimate: $5.41 |
Payout Ratio: 0.35 |
| Number of Estimates in the Fiscal Year Consensus: 8.00 |
Change In Payout Ratio: 0.17 |
| Estmated Long-Term EPS Growth Rate: % |
Last Dividend Paid: 02/18/2026 - $2.40 |
| Next EPS Report Date: 05/12/26 |
|
|
|
| |