| Zacks Company Profile for Life Time Group Holdings, Inc. (LTH : NYSE) |
|
|
| |
| • Company Description |
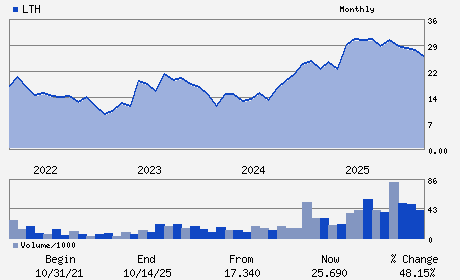
| Life Time Group Holdings Inc. reshaped the way consumers approach their health through omnichannel, healthy way of life communities that address all aspects of healthy living, healthy aging and healthy entertainment. Life Time Group Holdings Inc. is based in CHANHASSEN, Minn.
Number of Employees: 44,000 |
|
|
| |
| • Price / Volume Information |
| Yesterday's Closing Price: $26.30 |
Daily Weekly Monthly
 |
| 20 Day Moving Average: 2,855,013 shares |
| Shares Outstanding: 221.80 (millions) |
| Market Capitalization: $5,833.47 (millions) |
| Beta: 1.69 |
| 52 Week High: $34.99 |
| 52 Week Low: $24.14 |
| Short Interest Ratio: |
| |
% Price Change |
% Price Change Relative to S&P 500 |
| 4 Week |
-10.24% |
-7.52% |
| 12 Week |
-0.45% |
1.69% |
| Year To Date |
-1.05% |
-0.65% |
|
|
|
|
| |
|
|
| |
| • General Corporate Information |
Officers
Bahram Akradi - Founder; Chairman and Chief Executive Officer
Erik Weaver - Executive Vice President and Chief Financial Offic
Jimena Almendares - Director
Joel Alsfine - Director
Donna Coallier - Director
|
|
Peer Information
Life Time Group Holdings, Inc. (KJFI)
Life Time Group Holdings, Inc. (MBEW)
Life Time Group Holdings, Inc. (DVD)
Life Time Group Holdings, Inc. (GCCXQ)
Life Time Group Holdings, Inc. (AMIEQ)
Life Time Group Holdings, Inc. (FAIR)
|
|
Industry / Sector / Ticker Info
Analyst Coverage: No
Industry Group: LEISURE&REC SVS
Sector: Consumer Discretionary
CUSIP: 53190C102
SIC: 7997
|
|
Fiscal Year
Fiscal Year End: December
Last Reported Quarter: 12/01/25
Next Expected EPS Date: 05/14/26
|
|
Share - Related Items
Shares Outstanding: 221.80
Most Recent Split Date: (:1)
Beta: 1.69
Market Capitalization: $5,833.47 (millions)
|
|
|
|
|
| |
| • EPS Information |
• Dividend Information |
| Analyst Coverage: No |
Dividend Yield: 0.00% |
| Current Fiscal Quarter EPS Consensus Estimate: $0.33 |
Indicated Annual Dividend: $0.00 |
| Current Fiscal Year EPS Consensus Estimate: $1.39 |
Payout Ratio: 0.00 |
| Number of Estimates in the Fiscal Year Consensus: 3.00 |
Change In Payout Ratio: 0.00 |
| Estmated Long-Term EPS Growth Rate: 16.04% |
Last Dividend Paid: NA - $0.00 |
| Next EPS Report Date: 05/14/26 |
|
|
|
| |