| Zacks Company Profile for Luvu Brands, Inc. (LUVU : OTC) |
|
|
| |
| • Company Description |
| Luvu Brands, Inc. is a manufactures brand in the wellness, lifestyle and casual furniture and seating categories. The Company manages, markets and distributes its products directly to consumers through the Websites including liberator.com, theliberator.co.uk, jaxxliving.com and avanacomfort.com. Luvu Brands, Inc. is headquartered in Atlanta, Georgia.
Number of Employees: 195 |
|
|
| |
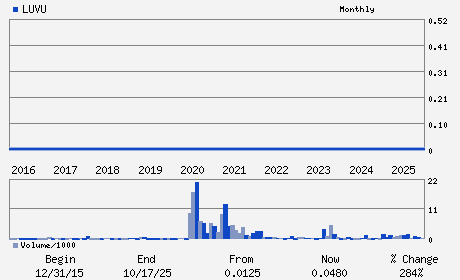
| • Price / Volume Information |
| Yesterday's Closing Price: $0.03 |
Daily Weekly Monthly
 |
| 20 Day Moving Average: 35,982 shares |
| Shares Outstanding: 76.83 (millions) |
| Market Capitalization: $2.13 (millions) |
| Beta: 1.60 |
| 52 Week High: $0.06 |
| 52 Week Low: $0.02 |
| Short Interest Ratio: |
| |
% Price Change |
% Price Change Relative to S&P 500 |
| 4 Week |
-7.67% |
-4.09% |
| 12 Week |
-26.91% |
-23.52% |
| Year To Date |
-8.58% |
-5.53% |
|
|
|
|
| |
|
|
| |
| • General Corporate Information |
Officers
Louis S. Friedman - Chief Executive Officer; President; Director
Christopher Knauf - Chief Financial Officer
Leslie S. Vogelman - Treasurer
Manuel Munoz - Chief Information Officer
Thomas E. Burress - Director
|
|
Peer Information
Luvu Brands, Inc. (LENXQ)
Luvu Brands, Inc. (BFXXQ)
Luvu Brands, Inc. (CENT)
Luvu Brands, Inc. (FTDL)
Luvu Brands, Inc. (BTH)
Luvu Brands, Inc. (JAH)
|
|
Industry / Sector / Ticker Info
Analyst Coverage: No
Industry Group: CONSM PD-MISC DIS
Sector: Consumer Discretionary
CUSIP: 55066U108
SIC: 2510
|
|
Fiscal Year
Fiscal Year End: June
Last Reported Quarter: 12/01/25
Next Expected EPS Date: 05/21/26
|
|
Share - Related Items
Shares Outstanding: 76.83
Most Recent Split Date: (:1)
Beta: 1.60
Market Capitalization: $2.13 (millions)
|
|
|
|
|
| |
| • EPS Information |
• Dividend Information |
| Analyst Coverage: No |
Dividend Yield: 0.00% |
| Current Fiscal Quarter EPS Consensus Estimate: $ |
Indicated Annual Dividend: $0.00 |
| Current Fiscal Year EPS Consensus Estimate: $ |
Payout Ratio: |
| Number of Estimates in the Fiscal Year Consensus: |
Change In Payout Ratio: |
| Estmated Long-Term EPS Growth Rate: % |
Last Dividend Paid: NA - $0.00 |
| Next EPS Report Date: 05/21/26 |
|
|
|
| |