| Zacks Company Profile for Marathon Digital Holdings, Inc. (MARA : NSDQ) |
|
|
| |
| • Company Description |
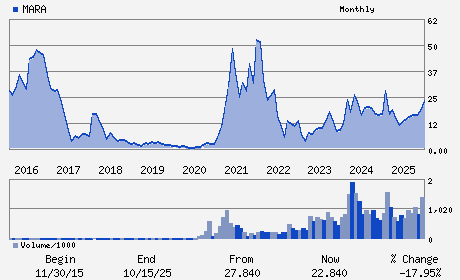
| Marathon Digital Holdings is a digital asset technology company which mines cryptocurrencies, with a focus on the blockchain ecosystem and the generation of digital assets. Marathon Digital Holdings, formerly known as Marathon Patent Group Inc., is based in LAS VEGAS.
Number of Employees: 266 |
|
|
| |
| • Price / Volume Information |
| Yesterday's Closing Price: $9.32 |
Daily Weekly Monthly
 |
| 20 Day Moving Average: 46,549,432 shares |
| Shares Outstanding: 380.23 (millions) |
| Market Capitalization: $3,543.79 (millions) |
| Beta: 5.51 |
| 52 Week High: $23.45 |
| 52 Week Low: $6.66 |
| Short Interest Ratio: |
| |
% Price Change |
% Price Change Relative to S&P 500 |
| 4 Week |
17.68% |
21.30% |
| 12 Week |
-8.45% |
-5.66% |
| Year To Date |
3.79% |
7.12% |
|
|
|
|
| |
| • Address & Contact Information |
| Street Address |
Phone / Fax |
Email Address |
Web URL |
1010 South Federal Highway Suite 2700
-
Hallandale Beach,FL 33009
USA |
ph: 800-804-1690
fax: 703-956-2521 |
ir@mara.com |
http://www.mara.com |
|
|
| |
| • General Corporate Information |
Officers
Fred Thiel - Chief Executive Officer and Chairman of the Board
Salman Khan - Chief Financial Officer
Georges Antoun - Director
Janet George - Director
Barbara Humpton - Director
|
|
Peer Information
Marathon Digital Holdings, Inc. (EIIN)
Marathon Digital Holdings, Inc. (AFMI)
Marathon Digital Holdings, Inc. (DRL)
Marathon Digital Holdings, Inc. (GRFPY)
Marathon Digital Holdings, Inc. (IGOT)
Marathon Digital Holdings, Inc. (ATLC)
|
|
Industry / Sector / Ticker Info
Analyst Coverage: No
Industry Group: FIN-MISC SVCS
Sector: Finance
CUSIP: 565788106
SIC: 6199
|
|
Fiscal Year
Fiscal Year End: December
Last Reported Quarter: 12/01/25
Next Expected EPS Date: 05/14/26
|
|
Share - Related Items
Shares Outstanding: 380.23
Most Recent Split Date: 4.00 (0.25:1)
Beta: 5.51
Market Capitalization: $3,543.79 (millions)
|
|
|
|
|
| |
| • EPS Information |
• Dividend Information |
| Analyst Coverage: No |
Dividend Yield: 0.00% |
| Current Fiscal Quarter EPS Consensus Estimate: $-0.25 |
Indicated Annual Dividend: $0.00 |
| Current Fiscal Year EPS Consensus Estimate: $-0.80 |
Payout Ratio: |
| Number of Estimates in the Fiscal Year Consensus: 2.00 |
Change In Payout Ratio: |
| Estmated Long-Term EPS Growth Rate: % |
Last Dividend Paid: NA - $0.00 |
| Next EPS Report Date: 05/14/26 |
|
|
|
| |