| Zacks Company Profile for Malibu Boats, Inc. (MBUU : NSDQ) |
|
|
| |
| • Company Description |
| Malibu Boats, Inc. operates as a designer, manufacturer and marketer of sport boats primarily in the United States. The Company sells its boats under two brands: Malibu and Axis Wake Research. Its sport boats used for water sports including water skiing, wakeboarding and wake surfing as well as for general recreational boating use. Malibu Boats, Inc. is based in Loudon, United States.
Number of Employees: 2,200 |
|
|
| |
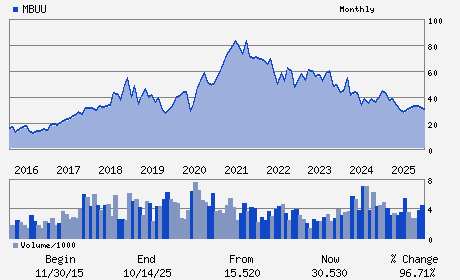
| • Price / Volume Information |
| Yesterday's Closing Price: $27.88 |
Daily Weekly Monthly
 |
| 20 Day Moving Average: 285,151 shares |
| Shares Outstanding: 19.64 (millions) |
| Market Capitalization: $547.48 (millions) |
| Beta: 1.14 |
| 52 Week High: $39.65 |
| 52 Week Low: $23.84 |
| Short Interest Ratio: |
| |
% Price Change |
% Price Change Relative to S&P 500 |
| 4 Week |
2.35% |
3.31% |
| 12 Week |
9.72% |
-2.46% |
| Year To Date |
-1.17% |
-10.93% |
|
|
|
|
| |
|
|
| |
| • General Corporate Information |
Officers
Steven D. Menneto - Chief Executive Officer; President and Director
Michael K. Hooks - Chairman of the Board and Director
Bruce W. Beckman - Chief Financial Officer
James R. Buch - Director
Ivar S. Chhina - Director
|
|
Peer Information
Malibu Boats, Inc. (BAJAY)
Malibu Boats, Inc. (ESCA)
Malibu Boats, Inc. (GOYL)
Malibu Boats, Inc. (FTSP)
Malibu Boats, Inc. (KTO)
Malibu Boats, Inc. (BOLL)
|
|
Industry / Sector / Ticker Info
Analyst Coverage: No
Industry Group: LEISURE&REC PRD
Sector: Consumer Discretionary
CUSIP: 56117J100
SIC: 3730
|
|
Fiscal Year
Fiscal Year End: June
Last Reported Quarter: 03/01/26
Next Expected EPS Date: 08/27/26
|
|
Share - Related Items
Shares Outstanding: 19.64
Most Recent Split Date: (:1)
Beta: 1.14
Market Capitalization: $547.48 (millions)
|
|
|
|
|
| |
| • EPS Information |
• Dividend Information |
| Analyst Coverage: No |
Dividend Yield: 0.00% |
| Current Fiscal Quarter EPS Consensus Estimate: $0.83 |
Indicated Annual Dividend: $0.00 |
| Current Fiscal Year EPS Consensus Estimate: $1.37 |
Payout Ratio: 0.00 |
| Number of Estimates in the Fiscal Year Consensus: 3.00 |
Change In Payout Ratio: 0.00 |
| Estmated Long-Term EPS Growth Rate: % |
Last Dividend Paid: NA - $0.00 |
| Next EPS Report Date: 08/27/26 |
|
|
|
| |