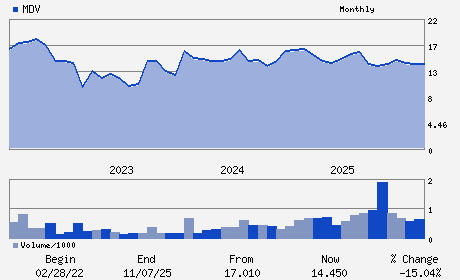
| Zacks Company Profile for Modiv Industrial, Inc. (MDV : NYSE) |
|
|
| |
| • Company Description |
| Modiv Industrial Inc. is an internally managed REIT. The company acquires, owns and manages a portfolio of single-tenant net-lease real estate. Modiv Industrial Inc., formerly known as Modiv Inc., is based in RENO, Nev.
Number of Employees: 9 |
|
|
| |
| • Price / Volume Information |
| Yesterday's Closing Price: $15.98 |
Daily Weekly Monthly
 |
| 20 Day Moving Average: 68,490 shares |
| Shares Outstanding: 10.32 (millions) |
| Market Capitalization: $164.90 (millions) |
| Beta: -0.25 |
| 52 Week High: $17.15 |
| 52 Week Low: $13.80 |
| Short Interest Ratio: |
| |
% Price Change |
% Price Change Relative to S&P 500 |
| 4 Week |
10.06% |
2.03% |
| 12 Week |
4.86% |
1.73% |
| Year To Date |
11.05% |
4.52% |
|
|
|
|
| |
| • Address & Contact Information |
| Street Address |
Phone / Fax |
Email Address |
Web URL |
1500 NORTH GRANT STREET #5609
-
DENVER,CO 80203
USA |
ph: 888-686-6348
fax: - |
ir@modiv.com |
http://www.modiv.com |
|
|
| |
| • General Corporate Information |
Officers
Aaron S. Halfacre - Chief Executive Officer and President
Thomas H. Nolan, Jr. - Chairman
Raymond J. Pacini - Executive Vice President; Chief Financial Officer;
Christopher R. Gingras - Director
Kimberly Smith - Director
|
|
Peer Information
Modiv Industrial, Inc. (CPT)
Modiv Industrial, Inc. (BHM)
Modiv Industrial, Inc. (EQR)
Modiv Industrial, Inc. (SAFE)
Modiv Industrial, Inc. (AEC)
Modiv Industrial, Inc. (VRE)
|
|
Industry / Sector / Ticker Info
Analyst Coverage: No
Industry Group: REIT-EQTY TRUST - RESID
Sector: Finance
CUSIP: 60784B101
SIC: 6798
|
|
Fiscal Year
Fiscal Year End: December
Last Reported Quarter: 12/01/25
Next Expected EPS Date: 05/06/26
|
|
Share - Related Items
Shares Outstanding: 10.32
Most Recent Split Date: (:1)
Beta: -0.25
Market Capitalization: $164.90 (millions)
|
|
|
|
|
| |
| • EPS Information |
• Dividend Information |
| Analyst Coverage: No |
Dividend Yield: 7.51% |
| Current Fiscal Quarter EPS Consensus Estimate: $0.39 |
Indicated Annual Dividend: $1.20 |
| Current Fiscal Year EPS Consensus Estimate: $1.50 |
Payout Ratio: 0.84 |
| Number of Estimates in the Fiscal Year Consensus: 1.00 |
Change In Payout Ratio: 0.03 |
| Estmated Long-Term EPS Growth Rate: % |
Last Dividend Paid: 03/31/2026 - $0.30 |
| Next EPS Report Date: 05/06/26 |
|
|
|
| |