| Zacks Company Profile for Medpace Holdings, Inc. (MEDP : NSDQ) |
|
|
| |
| • Company Description |
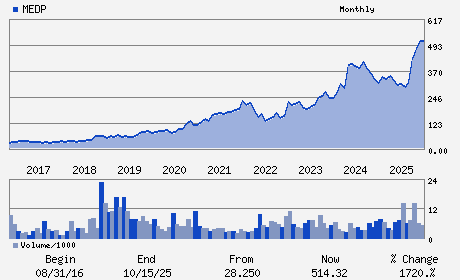
| Medpace Holdings, Inc. is a scientifically-driven, global, full-service clinical contract research organization which provides Phase I-IV clinical development services to the biotechnology, pharmaceutical and medical device industries. Medpace Holdings, Inc. is headquartered in Cincinnati, Ohio.
Number of Employees: 6,200 |
|
|
| |
| • Price / Volume Information |
| Yesterday's Closing Price: $450.41 |
Daily Weekly Monthly
 |
| 20 Day Moving Average: 345,210 shares |
| Shares Outstanding: 28.38 (millions) |
| Market Capitalization: $12,783.21 (millions) |
| Beta: 1.44 |
| 52 Week High: $628.92 |
| 52 Week Low: $250.05 |
| Short Interest Ratio: |
| |
% Price Change |
% Price Change Relative to S&P 500 |
| 4 Week |
5.23% |
8.47% |
| 12 Week |
-20.75% |
-18.33% |
| Year To Date |
-19.81% |
-17.23% |
|
|
|
|
| |
|
|
| |
| • General Corporate Information |
Officers
August J. Troendle - Chief Executive Officer and Chairman of the Board
Kevin M. Brady - Chief Financial Officer
Brian T. Carley - Director
Robert O. Kraft - Director
Fred B. Davenport Jr. - Director
|
|
Peer Information
Medpace Holdings, Inc. (CHCR)
Medpace Holdings, Inc. (ESRX)
Medpace Holdings, Inc. (MYDP)
Medpace Holdings, Inc. (COR)
Medpace Holdings, Inc. (GBCS)
Medpace Holdings, Inc. (LAXAF)
|
|
Industry / Sector / Ticker Info
Analyst Coverage: No
Industry Group: Medical Services
Sector: Medical
CUSIP: 58506Q109
SIC: 8731
|
|
Fiscal Year
Fiscal Year End: December
Last Reported Quarter: 12/01/25
Next Expected EPS Date: 04/20/26
|
|
Share - Related Items
Shares Outstanding: 28.38
Most Recent Split Date: (:1)
Beta: 1.44
Market Capitalization: $12,783.21 (millions)
|
|
|
|
|
| |
| • EPS Information |
• Dividend Information |
| Analyst Coverage: No |
Dividend Yield: 0.00% |
| Current Fiscal Quarter EPS Consensus Estimate: $3.74 |
Indicated Annual Dividend: $0.00 |
| Current Fiscal Year EPS Consensus Estimate: $17.04 |
Payout Ratio: 0.00 |
| Number of Estimates in the Fiscal Year Consensus: 6.00 |
Change In Payout Ratio: 0.00 |
| Estmated Long-Term EPS Growth Rate: 12.24% |
Last Dividend Paid: NA - $0.00 |
| Next EPS Report Date: 04/20/26 |
|
|
|
| |