| Zacks Company Profile for Magnite, Inc. (MGNI : NSDQ) |
|
|
| |
| • Company Description |
| Magnite Inc. provides sell-side advertising platform. The company's omnichannel advertising platform enables publishers to monetize across all auction types and formats including CTV, desktop display, video, audio and mobile. Magnite Inc., formerly known as the Rubicon Project Inc., is based in CA, United States.
Number of Employees: 971 |
|
|
| |
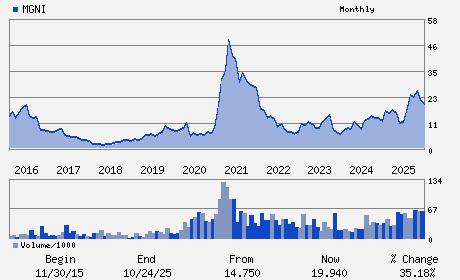
| • Price / Volume Information |
| Yesterday's Closing Price: $12.11 |
Daily Weekly Monthly
 |
| 20 Day Moving Average: 2,292,124 shares |
| Shares Outstanding: 144.36 (millions) |
| Market Capitalization: $1,748.25 (millions) |
| Beta: 2.34 |
| 52 Week High: $26.65 |
| 52 Week Low: $8.22 |
| Short Interest Ratio: |
| |
% Price Change |
% Price Change Relative to S&P 500 |
| 4 Week |
1.17% |
6.61% |
| 12 Week |
-25.39% |
-22.51% |
| Year To Date |
-25.39% |
-22.51% |
|
|
|
|
| |
|
|
| |
| • General Corporate Information |
Officers
Michael Barrett - Chief Executive Officer and Director
David Day - Chief Financial Officer
Brian Gephart - Chief Accounting Officer
Paul Caine - Director
Sarah P. Harden - Director
|
|
Peer Information
Magnite, Inc. (ADP)
Magnite, Inc. (CWLD)
Magnite, Inc. (CYBA.)
Magnite, Inc. (ZVLO)
Magnite, Inc. (AZPN)
Magnite, Inc. (ATIS)
|
|
Industry / Sector / Ticker Info
Analyst Coverage: No
Industry Group: INTERNET SOFTWARE
Sector: Computer and Technology
CUSIP: 55955D100
SIC: 7370
|
|
Fiscal Year
Fiscal Year End: December
Last Reported Quarter: 12/01/25
Next Expected EPS Date: 05/06/26
|
|
Share - Related Items
Shares Outstanding: 144.36
Most Recent Split Date: (:1)
Beta: 2.34
Market Capitalization: $1,748.25 (millions)
|
|
|
|
|
| |
| • EPS Information |
• Dividend Information |
| Analyst Coverage: No |
Dividend Yield: 0.00% |
| Current Fiscal Quarter EPS Consensus Estimate: $-0.04 |
Indicated Annual Dividend: $0.00 |
| Current Fiscal Year EPS Consensus Estimate: $0.68 |
Payout Ratio: 0.00 |
| Number of Estimates in the Fiscal Year Consensus: 2.00 |
Change In Payout Ratio: 0.00 |
| Estmated Long-Term EPS Growth Rate: 27.44% |
Last Dividend Paid: NA - $0.00 |
| Next EPS Report Date: 05/06/26 |
|
|
|
| |