| Zacks Company Profile for MKS Inc. (MKSI : NSDQ) |
|
|
| |
| • Company Description |
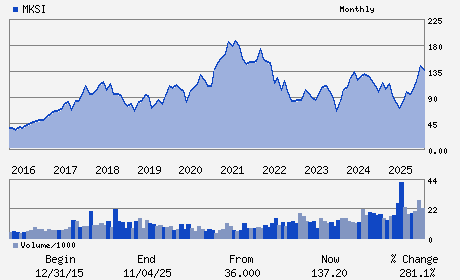
| MKS Inc. provides foundational technology solutions to semiconductor manufacturing, electronics and packaging and specialty industrial applications principally in the United States, China, South Korea, Japan, Taiwan, Singapore and internationally. MKS Inc., formerly known as MKS Instruments Inc., is based in Andover, Massachusetts.
Number of Employees: 10,300 |
|
|
| |
| • Price / Volume Information |
| Yesterday's Closing Price: $234.66 |
Daily Weekly Monthly
 |
| 20 Day Moving Average: 1,126,169 shares |
| Shares Outstanding: 67.32 (millions) |
| Market Capitalization: $15,797.71 (millions) |
| Beta: 1.90 |
| 52 Week High: $269.91 |
| 52 Week Low: $54.84 |
| Short Interest Ratio: |
| |
% Price Change |
% Price Change Relative to S&P 500 |
| 4 Week |
11.74% |
14.41% |
| 12 Week |
26.11% |
33.46% |
| Year To Date |
46.85% |
52.71% |
|
|
|
|
| |
|
|
| |
| • General Corporate Information |
Officers
John T.C. Lee - Chief Executive Officer
Gerald G. Colella - Chairman of the Board of Directors
Ramakumar Mayampurath - Executive Vice President and Chief Financial Offic
Michelle M. McCarthy - Vice President and Chief Accounting Officer
Rajeev Batra - Director
|
|
Peer Information
MKS Inc. (REFR)
MKS Inc. (BELFA)
MKS Inc. (DIPC)
MKS Inc. (V.SSC)
MKS Inc. (BNSOF)
MKS Inc. (CUB.)
|
|
Industry / Sector / Ticker Info
Analyst Coverage: No
Industry Group: ELEC PRODS-MISC
Sector: Computer and Technology
CUSIP: 55306N104
SIC: 3823
|
|
Fiscal Year
Fiscal Year End: December
Last Reported Quarter: 12/01/25
Next Expected EPS Date: 05/06/26
|
|
Share - Related Items
Shares Outstanding: 67.32
Most Recent Split Date: (:1)
Beta: 1.90
Market Capitalization: $15,797.71 (millions)
|
|
|
|
|
| |
| • EPS Information |
• Dividend Information |
| Analyst Coverage: No |
Dividend Yield: 0.43% |
| Current Fiscal Quarter EPS Consensus Estimate: $2.32 |
Indicated Annual Dividend: $1.00 |
| Current Fiscal Year EPS Consensus Estimate: $9.85 |
Payout Ratio: 0.11 |
| Number of Estimates in the Fiscal Year Consensus: 8.00 |
Change In Payout Ratio: -0.01 |
| Estmated Long-Term EPS Growth Rate: 18.91% |
Last Dividend Paid: 02/23/2026 - $0.25 |
| Next EPS Report Date: 05/06/26 |
|
|
|
| |