| Zacks Company Profile for MillerKnoll, Inc. (MLKN : NSDQ) |
|
|
| |
| • Company Description |
| MillerKnoll provides design solutions. It brand includes Herman Miller and Knoll, plus Colebrook Bosson Saunders, DatesWeiser, Design Within Reach, Edelman Leather, Fully, Geiger, HAY, Holly Hunt, KnollTextiles, Maars Living Walls, Maharam, Muuto, naughtone and Spinneybec FilzFelt. MillerKnoll, formerly known as Herman Miller Inc., is based in ZEELAND, Mich.
Number of Employees: 10,382 |
|
|
| |
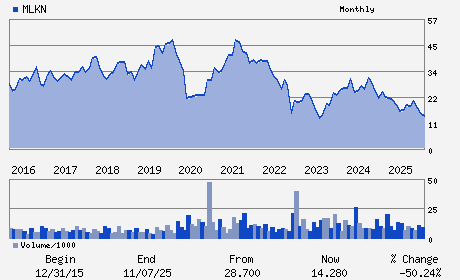
| • Price / Volume Information |
| Yesterday's Closing Price: $14.46 |
Daily Weekly Monthly
 |
| 20 Day Moving Average: 712,921 shares |
| Shares Outstanding: 68.38 (millions) |
| Market Capitalization: $988.70 (millions) |
| Beta: 1.41 |
| 52 Week High: $23.18 |
| 52 Week Low: $13.77 |
| Short Interest Ratio: |
| |
% Price Change |
% Price Change Relative to S&P 500 |
| 4 Week |
-11.12% |
-15.53% |
| 12 Week |
-34.00% |
-38.87% |
| Year To Date |
-20.90% |
-25.42% |
|
|
|
|
| |
|
|
| |
| • General Corporate Information |
Officers
Andrea R. Owen - Chief Executive Officer;President and Director
Michael A. Volkema - Chairman of the Board
Jeffrey M. Stutz - Chief Financial Officer and Principal Accounting O
Tina Edekar Edmundson - Director
Jeanne K. Gang - Director
|
|
Peer Information
MillerKnoll, Inc. (DMIF.)
MillerKnoll, Inc. (NCL)
MillerKnoll, Inc. (FCPR)
MillerKnoll, Inc. (AMWD)
MillerKnoll, Inc. (SNBR)
MillerKnoll, Inc. (MLKN)
|
|
Industry / Sector / Ticker Info
Analyst Coverage: No
Industry Group: FURNITURE
Sector: Consumer Discretionary
CUSIP: 600544100
SIC: 2520
|
|
Fiscal Year
Fiscal Year End: May
Last Reported Quarter: 02/01/26
Next Expected EPS Date: 06/24/26
|
|
Share - Related Items
Shares Outstanding: 68.38
Most Recent Split Date: 3.00 (2.00:1)
Beta: 1.41
Market Capitalization: $988.70 (millions)
|
|
|
|
|
| |
| • EPS Information |
• Dividend Information |
| Analyst Coverage: No |
Dividend Yield: 5.19% |
| Current Fiscal Quarter EPS Consensus Estimate: $0.52 |
Indicated Annual Dividend: $0.75 |
| Current Fiscal Year EPS Consensus Estimate: $1.83 |
Payout Ratio: 0.39 |
| Number of Estimates in the Fiscal Year Consensus: 3.00 |
Change In Payout Ratio: 0.02 |
| Estmated Long-Term EPS Growth Rate: 12.00% |
Last Dividend Paid: 02/27/2026 - $0.19 |
| Next EPS Report Date: 06/24/26 |
|
|
|
| |