| Zacks Company Profile for Myomo, Inc. (MYO : AMEX) |
|
|
| |
| • Company Description |
| Myomo, Inc. is a commercial stage medical robotics company. It offers expanded mobility which suffering from neurological disorders and upper limb paralysis. The company develops and markets the MyoPro(R) product line of lightweight, non-invasive, powered arm braces to restore function in the paralyzed or weakened arms and hands of individuals. Myomo, Inc. is headquartered in Cambridge,Massachusetts.
Number of Employees: 195 |
|
|
| |
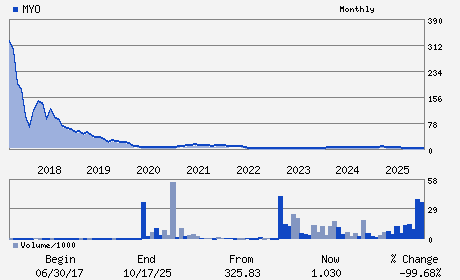
| • Price / Volume Information |
| Yesterday's Closing Price: $1.28 |
Daily Weekly Monthly
 |
| 20 Day Moving Average: 1,253,334 shares |
| Shares Outstanding: 38.64 (millions) |
| Market Capitalization: $49.46 (millions) |
| Beta: 1.47 |
| 52 Week High: $2.68 |
| 52 Week Low: $0.61 |
| Short Interest Ratio: |
| |
% Price Change |
% Price Change Relative to S&P 500 |
| 4 Week |
34.74% |
33.75% |
| 12 Week |
87.96% |
62.31% |
| Year To Date |
40.66% |
28.38% |
|
|
|
|
| |
| • Address & Contact Information |
| Street Address |
Phone / Fax |
Email Address |
Web URL |
45 Blue Sky Dr. Suite 101
-
Burlington,MA 01803
USA |
ph: 617-996-9058
fax: - |
ir@myomo.com |
http://www.myomo.com |
|
|
| |
| • General Corporate Information |
Officers
Paul R. Gudonis - President; Chief Executive Officer and Chairman
David A. Henry - Chief Financial Officer
Thomas A. Crowley, Jr. - Director
Thomas F. Kirk - Director
Milton M. Morris - Director
|
|
Peer Information
Myomo, Inc. (BJCT)
Myomo, Inc. (CADMQ)
Myomo, Inc. (APNO)
Myomo, Inc. (UPDC)
Myomo, Inc. (IMTIQ)
Myomo, Inc. (CYGN)
|
|
Industry / Sector / Ticker Info
Analyst Coverage: No
Industry Group: MED PRODUCTS
Sector: Medical
CUSIP: 62857J201
SIC: 3842
|
|
Fiscal Year
Fiscal Year End: December
Last Reported Quarter: 03/01/26
Next Expected EPS Date: 08/10/26
|
|
Share - Related Items
Shares Outstanding: 38.64
Most Recent Split Date: 1.00 (0.03:1)
Beta: 1.47
Market Capitalization: $49.46 (millions)
|
|
|
|
|
| |
| • EPS Information |
• Dividend Information |
| Analyst Coverage: No |
Dividend Yield: 0.00% |
| Current Fiscal Quarter EPS Consensus Estimate: $-0.09 |
Indicated Annual Dividend: $0.00 |
| Current Fiscal Year EPS Consensus Estimate: $-0.29 |
Payout Ratio: |
| Number of Estimates in the Fiscal Year Consensus: 2.00 |
Change In Payout Ratio: |
| Estmated Long-Term EPS Growth Rate: % |
Last Dividend Paid: NA - $0.00 |
| Next EPS Report Date: 08/10/26 |
|
|
|
| |