| Zacks Company Profile for Nordson Corporation (NDSN : NSDQ) |
|
|
| |
| • Company Description |
| Nordson Corporation is one of the leading manufacturers as well as distributors of products and systems designed to dispense, apply and control adhesives, coatings, polymers, sealants, biomaterials, and other fluids. The company's product line includes single-use components, stand-alone units for low-volume operations and microprocessor-based automated systems for high-speed, high-volume production lines. The company reports under Industrial Precision Solutions and Advanced Technology Solutions. Industrial Precision Solutions segment includes results of two segments - Industrial Coating Systems and Adhesive Dispensing Systems. The segment is engaged in providing processing and dispensing technology to customers in markets like non-durables, industrial and consumer durables. Advanced Technology Solutions segment provides services for inspection, surface treatment and controlled dispensing of material.
Number of Employees: 8,000 |
|
|
| |
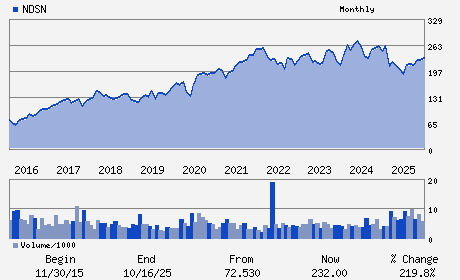
| • Price / Volume Information |
| Yesterday's Closing Price: $287.33 |
Daily Weekly Monthly
 |
| 20 Day Moving Average: 390,481 shares |
| Shares Outstanding: 55.72 (millions) |
| Market Capitalization: $16,009.45 (millions) |
| Beta: 0.99 |
| 52 Week High: $305.28 |
| 52 Week Low: $207.00 |
| Short Interest Ratio: |
| |
% Price Change |
% Price Change Relative to S&P 500 |
| 4 Week |
-0.39% |
-5.26% |
| 12 Week |
2.25% |
-7.86% |
| Year To Date |
19.51% |
8.46% |
|
|
|
|
| |
|
|
| |
| • General Corporate Information |
Officers
Sundaram Nagarajan - Chief Executive Officer;President and Director
Victor L. Richey, Jr. - Chair of the Board
Daniel R. Hopgood - Executive Vice President and Chief Financial Offic
Joseph Rutledge - Vice President and Chief Accounting Officer
Annette Clayton - Director
|
|
Peer Information
Nordson Corporation (B.)
Nordson Corporation (DXPE)
Nordson Corporation (AIT)
Nordson Corporation (GDI.)
Nordson Corporation (CTITQ)
Nordson Corporation (EBCOY)
|
|
Industry / Sector / Ticker Info
Analyst Coverage: No
Industry Group: MACH-GENL INDL
Sector: Industrial Products
CUSIP: 655663102
SIC: 3569
|
|
Fiscal Year
Fiscal Year End: October
Last Reported Quarter: 04/01/26
Next Expected EPS Date: 08/19/26
|
|
Share - Related Items
Shares Outstanding: 55.72
Most Recent Split Date: 4.00 (2.00:1)
Beta: 0.99
Market Capitalization: $16,009.45 (millions)
|
|
|
|
|
| |
| • EPS Information |
• Dividend Information |
| Analyst Coverage: No |
Dividend Yield: 1.14% |
| Current Fiscal Quarter EPS Consensus Estimate: $3.08 |
Indicated Annual Dividend: $3.28 |
| Current Fiscal Year EPS Consensus Estimate: $11.53 |
Payout Ratio: 0.30 |
| Number of Estimates in the Fiscal Year Consensus: 4.00 |
Change In Payout Ratio: 0.01 |
| Estmated Long-Term EPS Growth Rate: 13.00% |
Last Dividend Paid: 03/19/2026 - $0.82 |
| Next EPS Report Date: 08/19/26 |
|
|
|
| |