| Zacks Company Profile for NL Industries, Inc. (NL : NYSE) |
|
|
| |
| • Company Description |
| NL INDUSTRIES, INC. conducts its operations through its two wholly-owned subsidiaries, Kronos, Inc. and Rheox, Inc. Kronos, Inc. produces titanium dioxide pigments, chemical products used for imparting whiteness, brightness and opacity to a wide range of products, including paints, paper, plastics, fibers and ceramics. Rheox, Inc. produces rheological additives that control the flow and leveling characteristics for a variety of products, including paints, inks, lubricants, sealants, adhesives and cosmetics.
Number of Employees: 510 |
|
|
| |
| • Price / Volume Information |
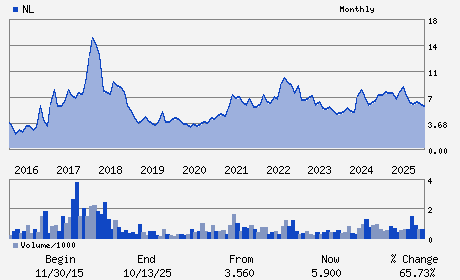
| Yesterday's Closing Price: $5.95 |
Daily Weekly Monthly
 |
| 20 Day Moving Average: 59,396 shares |
| Shares Outstanding: 48.86 (millions) |
| Market Capitalization: $290.73 (millions) |
| Beta: 0.24 |
| 52 Week High: $9.27 |
| 52 Week Low: $5.04 |
| Short Interest Ratio: |
| |
% Price Change |
% Price Change Relative to S&P 500 |
| 4 Week |
-4.34% |
-1.45% |
| 12 Week |
4.57% |
6.82% |
| Year To Date |
8.78% |
11.78% |
|
|
|
|
| |
| • Address & Contact Information |
| Street Address |
Phone / Fax |
Email Address |
Web URL |
5430 LBJ Freeway Suite 1700
-
DALLAS,TX 75240
USA |
ph: 972-233-1700
fax: 281-423-3216 |
None |
http://www.nl-ind.com |
|
|
| |
| • General Corporate Information |
Officers
Courtney J. Riley - President and Chief Executive Officer
Loretta J. Feehan - Chairman
Michael S. Simmons - Vice Chairman
John E. Harper - Director
Meredith W. Mendes - Director
|
|
Peer Information
NL Industries, Inc. (CSBHY)
NL Industries, Inc. (ARWM)
NL Industries, Inc. (FUL)
NL Industries, Inc. (IAX)
NL Industries, Inc. (AVD)
NL Industries, Inc. (ASH)
|
|
Industry / Sector / Ticker Info
Analyst Coverage: No
Industry Group: CHEM-SPECIALTY
Sector: Basic Materials
CUSIP: 629156407
SIC: 2810
|
|
Fiscal Year
Fiscal Year End: December
Last Reported Quarter: 12/01/25
Next Expected EPS Date: 05/06/26
|
|
Share - Related Items
Shares Outstanding: 48.86
Most Recent Split Date: 6.00 (1.01:1)
Beta: 0.24
Market Capitalization: $290.73 (millions)
|
|
|
|
|
| |
| • EPS Information |
• Dividend Information |
| Analyst Coverage: No |
Dividend Yield: 6.72% |
| Current Fiscal Quarter EPS Consensus Estimate: $ |
Indicated Annual Dividend: $0.40 |
| Current Fiscal Year EPS Consensus Estimate: $ |
Payout Ratio: 1.80 |
| Number of Estimates in the Fiscal Year Consensus: |
Change In Payout Ratio: 1.24 |
| Estmated Long-Term EPS Growth Rate: % |
Last Dividend Paid: NA - $0.00 |
| Next EPS Report Date: 05/06/26 |
|
|
|
| |