| Zacks Company Profile for ServiceNow, Inc. (NOW : NYSE) |
|
|
| |
| • Company Description |
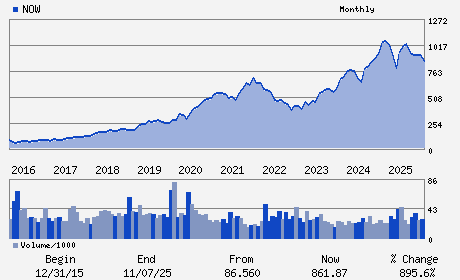
| ServiceNow Inc. provides cloud computing services that automate digital workflows to accelerate enterprise IT operations. The company's Now Platform enables enterprises to enhance productivity by streamlining system processes. By utilizing its product portfolio, customers can reduce the manual time taken by complex processes and consequently optimize total cost of ownership. Its solutions address the needs of many departments within an enterprise, including IT, HR, facilities, field service, marketing, customer service, security, legal & finance. The company has 3 product suites for IT management and operations: IT Service Management, IT Operations Management and IT Business Management solutions. Non-IT products include Customer Service, HR and Security Operations. Its end-markets include financial services, consumer products, IT services, health care, government, education and technology. ServiceNow derives revenues from two sources: subscriptions and professional services & others.
Number of Employees: 29,187 |
|
|
| |
| • Price / Volume Information |
| Yesterday's Closing Price: $108.01 |
Daily Weekly Monthly
 |
| 20 Day Moving Average: 23,025,582 shares |
| Shares Outstanding: 1,046.00 (millions) |
| Market Capitalization: $112,978.46 (millions) |
| Beta: 0.99 |
| 52 Week High: $211.48 |
| 52 Week Low: $98.77 |
| Short Interest Ratio: |
| |
% Price Change |
% Price Change Relative to S&P 500 |
| 4 Week |
-7.69% |
-6.88% |
| 12 Week |
-36.79% |
-36.87% |
| Year To Date |
-29.49% |
-29.83% |
|
|
|
|
| |
|
|
| |
| • General Corporate Information |
Officers
William R. McDermott - Chairman and Chief Executive Officer
Gina Mastantuono - President and Chief Financial Officer
Kevin T. McBride - Chief Accounting Officer
Frederic B. Luddy - Director
Susan L. Bostrom - Director
|
|
Peer Information
ServiceNow, Inc. (UIS)
ServiceNow, Inc. (CTSH)
ServiceNow, Inc. (ASGN)
ServiceNow, Inc. (GTTNQ)
ServiceNow, Inc. (DXC)
ServiceNow, Inc. (DOX)
|
|
Industry / Sector / Ticker Info
Analyst Coverage: No
Industry Group: IT Services
Sector: Computer and Technology
CUSIP: 81762P102
SIC: 7372
|
|
Fiscal Year
Fiscal Year End: December
Last Reported Quarter: 12/01/25
Next Expected EPS Date: 04/22/26
|
|
Share - Related Items
Shares Outstanding: 1,046.00
Most Recent Split Date: 12.00 (5.00:1)
Beta: 0.99
Market Capitalization: $112,978.46 (millions)
|
|
|
|
|
| |
| • EPS Information |
• Dividend Information |
| Analyst Coverage: No |
Dividend Yield: 0.00% |
| Current Fiscal Quarter EPS Consensus Estimate: $0.54 |
Indicated Annual Dividend: $0.00 |
| Current Fiscal Year EPS Consensus Estimate: $2.48 |
Payout Ratio: 0.00 |
| Number of Estimates in the Fiscal Year Consensus: 17.00 |
Change In Payout Ratio: 0.00 |
| Estmated Long-Term EPS Growth Rate: 23.94% |
Last Dividend Paid: NA - $0.00 |
| Next EPS Report Date: 04/22/26 |
|
|
|
| |