| Zacks Company Profile for Nippon Paint Holdings Co., Ltd. (NPCPF : OTC) |
|
|
| |
| • Company Description |
| Nippon Paint Holdings Co. Ltd. manufactures and sells paints and coatings primarily in Japan, Asia, North America, Europe and internationally. It offers automotive coatings, industrial coatings, trade-use paints as well as marine coatings. Nippon Paint Holdings Co. Ltd. is headquartered in Osaka, Japan.
Number of Employees: 38,500 |
|
|
| |
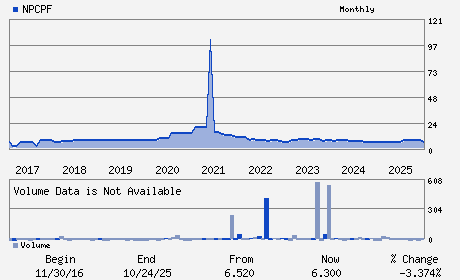
| • Price / Volume Information |
| Yesterday's Closing Price: $6.70 |
Daily Weekly Monthly
 |
| 20 Day Moving Average: 1,070 shares |
| Shares Outstanding: 2,327.94 (millions) |
| Market Capitalization: $15,585.57 (millions) |
| Beta: 0.91 |
| 52 Week High: $8.12 |
| 52 Week Low: $6.13 |
| Short Interest Ratio: |
| |
% Price Change |
% Price Change Relative to S&P 500 |
| 4 Week |
-4.22% |
0.93% |
| 12 Week |
4.61% |
8.63% |
| Year To Date |
4.61% |
8.63% |
|
|
|
|
| |
|
|
| |
| • General Corporate Information |
Officers
Yuichiro Wakatsuki - Co-President; Representative Executive Officer; Di
Goh Hup Jin - Chairman
Wee Siew Kim - Representative Executive Officer & Co-President; D
Hidekazu Kudo - Corporate Officer; Deputy CFO; General Manager; Fi
Hara Hisashi - Director
|
|
Peer Information
Nippon Paint Holdings Co., Ltd. (FAME)
Nippon Paint Holdings Co., Ltd. (FMST.)
Nippon Paint Holdings Co., Ltd. (IBCL)
Nippon Paint Holdings Co., Ltd. (CMNFY)
Nippon Paint Holdings Co., Ltd. (NPCPF)
Nippon Paint Holdings Co., Ltd. (T.SIC)
|
|
Industry / Sector / Ticker Info
Analyst Coverage: No
Industry Group: PAINTS&REL PRDS
Sector: Construction
CUSIP: J55053128
SIC: 8880
|
|
Fiscal Year
Fiscal Year End: December
Last Reported Quarter: 12/01/25
Next Expected EPS Date: 05/13/26
|
|
Share - Related Items
Shares Outstanding: 2,327.94
Most Recent Split Date: 3.00 (5.00:1)
Beta: 0.91
Market Capitalization: $15,585.57 (millions)
|
|
|
|
|
| |
| • EPS Information |
• Dividend Information |
| Analyst Coverage: No |
Dividend Yield: 0.00% |
| Current Fiscal Quarter EPS Consensus Estimate: $ |
Indicated Annual Dividend: $0.00 |
| Current Fiscal Year EPS Consensus Estimate: $ |
Payout Ratio: 0.00 |
| Number of Estimates in the Fiscal Year Consensus: |
Change In Payout Ratio: -0.92 |
| Estmated Long-Term EPS Growth Rate: % |
Last Dividend Paid: NA - $0.00 |
| Next EPS Report Date: 05/13/26 |
|
|
|
| |