| Zacks Company Profile for Nomura Research Institute (NRILY : OTC) |
|
|
| |
| • Company Description |
| Nomura Research Institute, Ltd. provides research, business consulting and systems services. Its operating segment consists of Consulting, Financial Information Technology Solutions, Industrial IT Solutions, IT Platform Services and Others. Consulting segment provides management and systems consulting services. Financial IT Solutions segment offers IT solutions for securities, asset management, banking, and insurance sectors. Industrial IT Solutions segment deals with IT solutions and infrastructure services for distribution, manufacturing, service and healthcare industries, as well as for governments and other public agencies. IT Platform Services segment handles system management and advanced information technology solutions. It also conducts research for the development of new business operations and new products related to IT solutions. Others segment administers systems development and operation services on other businesses. Nomura Research Institute, Ltd. is headquartered in Tokyo, Japan.
Number of Employees: 7,645 |
|
|
| |
| • Price / Volume Information |
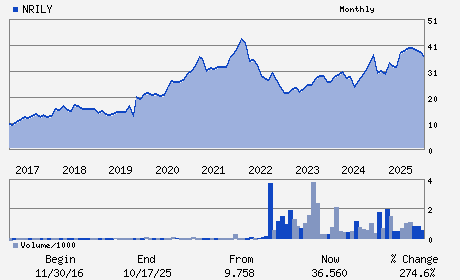
| Yesterday's Closing Price: $26.55 |
Daily Weekly Monthly
 |
| 20 Day Moving Average: 51,745 shares |
| Shares Outstanding: 573.50 (millions) |
| Market Capitalization: $15,226.31 (millions) |
| Beta: 0.64 |
| 52 Week High: $43.20 |
| 52 Week Low: $22.73 |
| Short Interest Ratio: |
| |
% Price Change |
% Price Change Relative to S&P 500 |
| 4 Week |
-4.97% |
-13.38% |
| 12 Week |
-5.52% |
-9.65% |
| Year To Date |
-30.26% |
-34.24% |
|
|
|
|
| |
| • Address & Contact Information |
| Street Address |
Phone / Fax |
Email Address |
Web URL |
Otemachi Financial City Grand Cube 1-9-2 Otemachi
-
Tokyo,M0 100-0004
JPN |
ph: 813-5533-2111
fax: - |
ir@nri.co.jp |
http://www.nri.com |
|
|
| |
| • General Corporate Information |
Officers
Kaga Yanagisawa - President & CEO
Shingo Konomoto - Chairman
Yo Akatsuka - Vice Chairman
Hidenori Anzai - Director
Shinoi Sakata - Director
|
|
Peer Information
Nomura Research Institute (EVOL)
Nomura Research Institute (RAMP)
Nomura Research Institute (EFOR)
Nomura Research Institute (LGTY)
Nomura Research Institute (ALOT)
Nomura Research Institute (CXT)
|
|
Industry / Sector / Ticker Info
Analyst Coverage: No
Industry Group: Technology Services
Sector: Business Services
CUSIP: 65538C206
SIC: 8880
|
|
Fiscal Year
Fiscal Year End: March
Last Reported Quarter: 03/01/26
Next Expected EPS Date: 07/27/26
|
|
Share - Related Items
Shares Outstanding: 573.50
Most Recent Split Date: 7.00 (0.75:1)
Beta: 0.64
Market Capitalization: $15,226.31 (millions)
|
|
|
|
|
| |
| • EPS Information |
• Dividend Information |
| Analyst Coverage: No |
Dividend Yield: 1.14% |
| Current Fiscal Quarter EPS Consensus Estimate: $ |
Indicated Annual Dividend: $0.30 |
| Current Fiscal Year EPS Consensus Estimate: $1.37 |
Payout Ratio: 1.38 |
| Number of Estimates in the Fiscal Year Consensus: 2.00 |
Change In Payout Ratio: 1.08 |
| Estmated Long-Term EPS Growth Rate: 12.50% |
Last Dividend Paid: NA - $0.00 |
| Next EPS Report Date: 07/27/26 |
|
|
|
| |