| Zacks Company Profile for Natera, Inc. (NTRA : NSDQ) |
|
|
| |
| • Company Description |
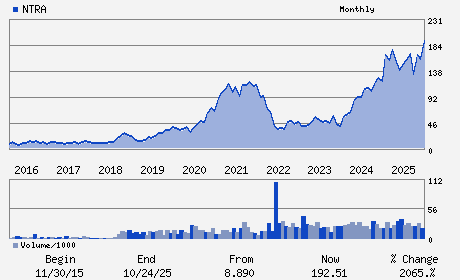
| Natera, Inc. offers genetic testing and diagnostics with proprietary bioinformatics and molecular technology. Natera, Inc. is headquartered in San Carlos, California.
Number of Employees: 6,140 |
|
|
| |
| • Price / Volume Information |
| Yesterday's Closing Price: $194.52 |
Daily Weekly Monthly
 |
| 20 Day Moving Average: 1,385,193 shares |
| Shares Outstanding: 141.73 (millions) |
| Market Capitalization: $27,569.56 (millions) |
| Beta: 1.65 |
| 52 Week High: $256.36 |
| 52 Week Low: $125.38 |
| Short Interest Ratio: |
| |
% Price Change |
% Price Change Relative to S&P 500 |
| 4 Week |
-7.16% |
-2.44% |
| 12 Week |
-15.42% |
-11.03% |
| Year To Date |
-15.09% |
-11.35% |
|
|
|
|
| |
| • Address & Contact Information |
| Street Address |
Phone / Fax |
Email Address |
Web URL |
13011 McCallen Pass Building A Suite 100
-
Austin,TX 78753
USA |
ph: 650-980-9190
fax: - |
investor@natera.com |
http://www.natera.com |
|
|
| |
| • General Corporate Information |
Officers
Steve Chapman - Chief Executive Officer and President
Matthew Rabinowitz - Executive Chairman
Michael Brophy - Chief Financial Officer
Roy Baynes - Director
Monica Bertagnolli - Director
|
|
Peer Information
Natera, Inc. (CHCR)
Natera, Inc. (ESRX)
Natera, Inc. (MYDP)
Natera, Inc. (COR)
Natera, Inc. (GBCS)
Natera, Inc. (LAXAF)
|
|
Industry / Sector / Ticker Info
Analyst Coverage: No
Industry Group: Medical Services
Sector: Medical
CUSIP: 632307104
SIC: 8071
|
|
Fiscal Year
Fiscal Year End: December
Last Reported Quarter: 12/01/25
Next Expected EPS Date: 05/14/26
|
|
Share - Related Items
Shares Outstanding: 141.73
Most Recent Split Date: (:1)
Beta: 1.65
Market Capitalization: $27,569.56 (millions)
|
|
|
|
|
| |
| • EPS Information |
• Dividend Information |
| Analyst Coverage: No |
Dividend Yield: 0.00% |
| Current Fiscal Quarter EPS Consensus Estimate: $-0.55 |
Indicated Annual Dividend: $0.00 |
| Current Fiscal Year EPS Consensus Estimate: $-1.76 |
Payout Ratio: |
| Number of Estimates in the Fiscal Year Consensus: 5.00 |
Change In Payout Ratio: |
| Estmated Long-Term EPS Growth Rate: % |
Last Dividend Paid: NA - $0.00 |
| Next EPS Report Date: 05/14/26 |
|
|
|
| |