| Zacks Company Profile for Envista Holdings Corporation (NVST : NYSE) |
|
|
| |
| • Company Description |
| Envista Holdings Corporation manufactures and sells dental products primarily in the United States and internationally. The company's Specialty Products & Technologies segment provides dental implant systems, guided surgery systems, biomaterials, prefabricated and custom-built prosthetics and dental eye loupes to oral surgeons, prosthodontists and periodontists; Equipment & Consumables segment develops, manufactures and markets dental equipment and supplies used in dental offices, including digital imaging systems, software and other visualization/magnification systems; handpieces and associated consumables; treatment units and other dental practice equipment; endodontic systems and related consumables; restorative materials and instruments, rotary burs, impression materials, bonding agents and cements and infection prevention products. Envista Holdings Corporation is based in Brea, California.
Number of Employees: 12,000 |
|
|
| |
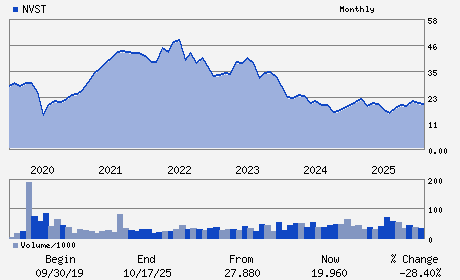
| • Price / Volume Information |
| Yesterday's Closing Price: $25.91 |
Daily Weekly Monthly
 |
| 20 Day Moving Average: 2,775,345 shares |
| Shares Outstanding: 162.73 (millions) |
| Market Capitalization: $4,216.28 (millions) |
| Beta: 0.88 |
| 52 Week High: $30.36 |
| 52 Week Low: $18.32 |
| Short Interest Ratio: |
| |
% Price Change |
% Price Change Relative to S&P 500 |
| 4 Week |
9.65% |
8.85% |
| 12 Week |
0.27% |
-13.41% |
| Year To Date |
19.35% |
8.92% |
|
|
|
|
| |
| • Address & Contact Information |
| Street Address |
Phone / Fax |
Email Address |
Web URL |
200 S. KRAEMER BLVD. BUILDING E
-
BREA,CA 92821
USA |
ph: 714-817-7000
fax: 714-817-5450 |
ir@envistaco.com |
http://www.envistaco.com |
|
|
| |
| • General Corporate Information |
Officers
Paul Keel - President; Chief Executive Officer
Scott Huennekens - Chairman of the Board
Eric Hammes - Senior Vice President and Chief Financial Officer
Faez Kaabi - Vice President
Wendy Carruthers - Director
|
|
Peer Information
Envista Holdings Corporation (BJCT)
Envista Holdings Corporation (CADMQ)
Envista Holdings Corporation (APNO)
Envista Holdings Corporation (UPDC)
Envista Holdings Corporation (IMTIQ)
Envista Holdings Corporation (CYGN)
|
|
Industry / Sector / Ticker Info
Analyst Coverage: No
Industry Group: MED PRODUCTS
Sector: Medical
CUSIP: 29415F104
SIC: 3843
|
|
Fiscal Year
Fiscal Year End: December
Last Reported Quarter: 03/01/26
Next Expected EPS Date: 07/30/26
|
|
Share - Related Items
Shares Outstanding: 162.73
Most Recent Split Date: (:1)
Beta: 0.88
Market Capitalization: $4,216.28 (millions)
|
|
|
|
|
| |
| • EPS Information |
• Dividend Information |
| Analyst Coverage: No |
Dividend Yield: 0.00% |
| Current Fiscal Quarter EPS Consensus Estimate: $0.33 |
Indicated Annual Dividend: $0.00 |
| Current Fiscal Year EPS Consensus Estimate: $1.42 |
Payout Ratio: 0.00 |
| Number of Estimates in the Fiscal Year Consensus: 7.00 |
Change In Payout Ratio: 0.00 |
| Estmated Long-Term EPS Growth Rate: 12.40% |
Last Dividend Paid: NA - $0.00 |
| Next EPS Report Date: 07/30/26 |
|
|
|
| |