| Zacks Company Profile for Oceaneering International, Inc. (OII : NYSE) |
|
|
| |
| • Company Description |
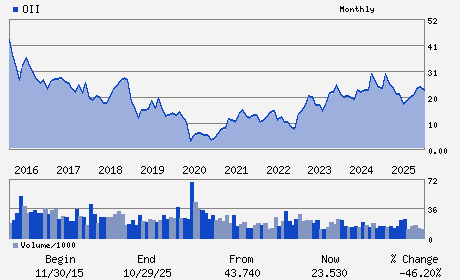
| Oceaneering International, Inc. is one of the leading suppliers of offshore equipment and technology solutions to the energy industry. The company provides specialized products and services for all phases of the offshore oilfield lifecycle - from exploration to decommissioning - with a focus on deep water. The company operates in five business segments namely Subsea Robotics, Manufactured Products, Offshore Projects Group, Integrity Management & Digital Solutions and Aerospace and Defense Technologies.
Number of Employees: 11,100 |
|
|
| |
| • Price / Volume Information |
| Yesterday's Closing Price: $36.33 |
Daily Weekly Monthly
 |
| 20 Day Moving Average: 1,270,374 shares |
| Shares Outstanding: 99.39 (millions) |
| Market Capitalization: $3,610.98 (millions) |
| Beta: 1.18 |
| 52 Week High: $38.99 |
| 52 Week Low: $15.48 |
| Short Interest Ratio: |
| |
% Price Change |
% Price Change Relative to S&P 500 |
| 4 Week |
2.34% |
10.53% |
| 12 Week |
46.20% |
57.44% |
| Year To Date |
51.19% |
62.50% |
|
|
|
|
| |
|
|
| |
| • General Corporate Information |
Officers
Roderick A. Larson - President and Chief Executive Officer and Director
M. Kevin McEvoy - Chairman of the Board
Michael W. Sumruld - Senior Vice President and Chief Financial Officer
Catherine E. Dunn - Vice President and Chief Accounting Officer
Karen H. Beachy - Director
|
|
Peer Information
Oceaneering International, Inc. (BJS)
Oceaneering International, Inc. (CXIPY)
Oceaneering International, Inc. (ALY)
Oceaneering International, Inc. (HLX)
Oceaneering International, Inc. (CNCJQ)
Oceaneering International, Inc. (FGHLQ)
|
|
Industry / Sector / Ticker Info
Analyst Coverage: No
Industry Group: OIL-FIELD SVCS
Sector: Oils/Energy
CUSIP: 675232102
SIC: 1389
|
|
Fiscal Year
Fiscal Year End: December
Last Reported Quarter: 12/01/25
Next Expected EPS Date: 04/22/26
|
|
Share - Related Items
Shares Outstanding: 99.39
Most Recent Split Date: 6.00 (2.00:1)
Beta: 1.18
Market Capitalization: $3,610.98 (millions)
|
|
|
|
|
| |
| • EPS Information |
• Dividend Information |
| Analyst Coverage: No |
Dividend Yield: 0.00% |
| Current Fiscal Quarter EPS Consensus Estimate: $0.38 |
Indicated Annual Dividend: $0.00 |
| Current Fiscal Year EPS Consensus Estimate: $1.83 |
Payout Ratio: 0.00 |
| Number of Estimates in the Fiscal Year Consensus: 2.00 |
Change In Payout Ratio: 0.00 |
| Estmated Long-Term EPS Growth Rate: % |
Last Dividend Paid: NA - $0.00 |
| Next EPS Report Date: 04/22/26 |
|
|
|
| |