| Zacks Company Profile for Ostin Technology Group Co., Ltd. (OST : NSDQ) |
|
|
| |
| • Company Description |
| Ostin Technology Group Co., Ltd. is a supplier of display modules and polarizers principally in China. The Company designs, develops and manufactures TFT-LCD display modules in a wide range of sizes and customized sizes which are mainly used in consumer electronics, outdoor LCD displays and automotive displays. It also manufactures polarizers used in the TFT-LCD display modules. Ostin Technology Group Co., Ltd., formerly known as OSTEN TECH GRP, is based in Nanjing, China.
Number of Employees: 352 |
|
|
| |
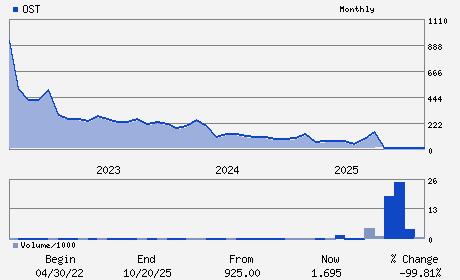
| • Price / Volume Information |
| Yesterday's Closing Price: $1.70 |
Daily Weekly Monthly
 |
| 20 Day Moving Average: 0 shares |
| Shares Outstanding: 5.99 (millions) |
| Market Capitalization: $10.16 (millions) |
| Beta: 0.65 |
| 52 Week High: $235.00 |
| 52 Week Low: $1.35 |
| Short Interest Ratio: |
| |
% Price Change |
% Price Change Relative to S&P 500 |
| 4 Week |
0.00% |
6.19% |
| 12 Week |
0.00% |
6.51% |
| Year To Date |
0.00% |
5.21% |
|
|
|
|
| |
| • Address & Contact Information |
| Street Address |
Phone / Fax |
Email Address |
Web URL |
Building 2 101 1 Kechuang Road Qixia District
-
Nanjing,F4 210046
CHN |
ph: 86-25-5859-5234
fax: 86-577-8659-8888 |
ir@austinelec.com |
http://ostin-technology.com |
|
|
| |
| • General Corporate Information |
Officers
Tao Ling - Chief Executive Officer and Chairman of the Board
Qiaoyun Xie - Chief Financial Officer
Xiaodong Zhai - Chief Technology Officer
Xiaohong Yin - Secretary and Director
Rongguo Cui - Director
|
|
Peer Information
Ostin Technology Group Co., Ltd. (SMTI.)
Ostin Technology Group Co., Ltd. (DDICQ)
Ostin Technology Group Co., Ltd. (CGGIQ)
Ostin Technology Group Co., Ltd. (CRDN)
Ostin Technology Group Co., Ltd. (CDTS)
Ostin Technology Group Co., Ltd. (AURAQ)
|
|
Industry / Sector / Ticker Info
Analyst Coverage: No
Industry Group: ELEC-MISC COMPONENTS
Sector: Computer and Technology
CUSIP: G67927122
SIC: 3679
|
|
Fiscal Year
Fiscal Year End: September
Last Reported Quarter: -
Next Expected EPS Date: 04/27/26
|
|
Share - Related Items
Shares Outstanding: 5.99
Most Recent Split Date: 8.00 (0.04:1)
Beta: 0.65
Market Capitalization: $10.16 (millions)
|
|
|
|
|
| |
| • EPS Information |
• Dividend Information |
| Analyst Coverage: No |
Dividend Yield: 0.00% |
| Current Fiscal Quarter EPS Consensus Estimate: $ |
Indicated Annual Dividend: $0.00 |
| Current Fiscal Year EPS Consensus Estimate: $ |
Payout Ratio: |
| Number of Estimates in the Fiscal Year Consensus: |
Change In Payout Ratio: |
| Estmated Long-Term EPS Growth Rate: % |
Last Dividend Paid: NA - $0.00 |
| Next EPS Report Date: 04/27/26 |
|
|
|
| |