| Zacks Company Profile for OTC Markets Group Inc. (OTCM : OTC) |
|
|
| |
| • Company Description |
| OTC Markets Group Inc. is an open, transparent, and connected marketplace platform providing financial information and technology services to broker-dealers, issuers of OTC traded securities, and market data consumers. Its OTC Link (registered) ATS directly links a diverse network of broker-dealers that provide liquidity and execution services for a wide spectrum of securities. Its OTCQuote.com, helps in viewing real-time OTC market quote and trade data; OTC FIX for quote submission, trading, and routing of execution reports. The company also provides data products comprising Real-Time+, a multicast data product suite that allows market data terminal providers and financial website operators to give the general public a view into the real-time pricing of 10,000 OTC securities. Other products include End-of-Day data file, Company data file, Quote History, research/data mining service. The company was formerly known as Pink OTC Markets Inc. and is headquartered in New York, New York.
Number of Employees: 130 |
|
|
| |
| • Price / Volume Information |
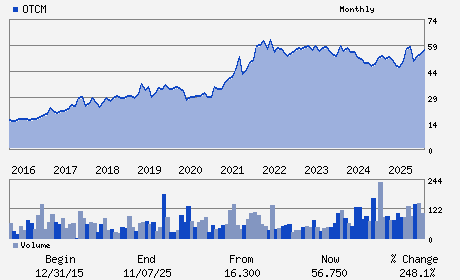
| Yesterday's Closing Price: $53.50 |
Daily Weekly Monthly
 |
| 20 Day Moving Average: 12,044 shares |
| Shares Outstanding: 12.04 (millions) |
| Market Capitalization: $644.31 (millions) |
| Beta: 0.30 |
| 52 Week High: $60.50 |
| 52 Week Low: $49.35 |
| Short Interest Ratio: |
| |
% Price Change |
% Price Change Relative to S&P 500 |
| 4 Week |
-2.55% |
-7.05% |
| 12 Week |
-1.38% |
-12.31% |
| Year To Date |
4.29% |
-5.82% |
|
|
|
|
| |
|
|
| |
| • General Corporate Information |
Officers
R. Cromwell Coulson - President and Chief Executive Officer; Director
Neal Wolkoff - Director and Chairman of the Board
Antonia Georgieva - Chief Financial Officer
Gary Baddeley - Director
Louisa Serene Schneider - Director
|
|
Peer Information
OTC Markets Group Inc. (SPGI)
OTC Markets Group Inc. (SOUM)
OTC Markets Group Inc. (CME)
OTC Markets Group Inc. (NDAQ)
OTC Markets Group Inc. (CBOE)
OTC Markets Group Inc. (NYX.)
|
|
Industry / Sector / Ticker Info
Analyst Coverage: No
Industry Group: Securities Exchanges
Sector: Finance
CUSIP: 67106F108
SIC: 6200
|
|
Fiscal Year
Fiscal Year End: December
Last Reported Quarter: 03/01/26
Next Expected EPS Date: 08/05/26
|
|
Share - Related Items
Shares Outstanding: 12.04
Most Recent Split Date: (:1)
Beta: 0.30
Market Capitalization: $644.31 (millions)
|
|
|
|
|
| |
| • EPS Information |
• Dividend Information |
| Analyst Coverage: No |
Dividend Yield: 2.24% |
| Current Fiscal Quarter EPS Consensus Estimate: $0.70 |
Indicated Annual Dividend: $1.20 |
| Current Fiscal Year EPS Consensus Estimate: $2.81 |
Payout Ratio: 0.45 |
| Number of Estimates in the Fiscal Year Consensus: 1.00 |
Change In Payout Ratio: 0.14 |
| Estmated Long-Term EPS Growth Rate: 13.00% |
Last Dividend Paid: 03/19/2026 - $0.30 |
| Next EPS Report Date: 08/05/26 |
|
|
|
| |