| Zacks Company Profile for Ouster, Inc. (OUST : NSDQ) |
|
|
| |
| • Company Description |
| Ouster Inc. is a provider of high-resolution digital lidar sensors for industrial automation, robotics, smart infrastructure and automotive industries. Ouster Inc., formerly known as Colonnade Acquisition Corp., is based in SAN FRANCISCO.
Number of Employees: 192 |
|
|
| |
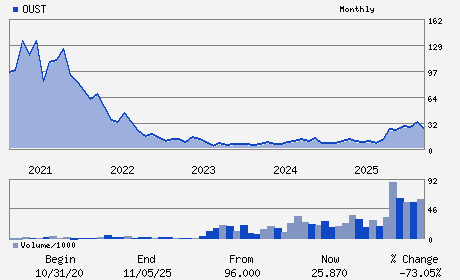
| • Price / Volume Information |
| Yesterday's Closing Price: $18.95 |
Daily Weekly Monthly
 |
| 20 Day Moving Average: 1,436,285 shares |
| Shares Outstanding: 60.01 (millions) |
| Market Capitalization: $1,137.10 (millions) |
| Beta: 2.91 |
| 52 Week High: $41.65 |
| 52 Week Low: $6.34 |
| Short Interest Ratio: |
| |
% Price Change |
% Price Change Relative to S&P 500 |
| 4 Week |
-9.03% |
-8.23% |
| 12 Week |
-23.53% |
-23.62% |
| Year To Date |
-12.43% |
-12.86% |
|
|
|
|
| |
|
|
| |
| • General Corporate Information |
Officers
Angus Pacala - Director; Co-Founder and Chief Executive Officer
Theodore Tewksbury - Chair of the Board of Director
Darien Spencer - Chief Operating Officer
Chen Geng - Interim Chief Financial Officer
Stephen A. Skaggs - Director
|
|
Peer Information
Ouster, Inc. (SMTI.)
Ouster, Inc. (DDICQ)
Ouster, Inc. (CGGIQ)
Ouster, Inc. (CRDN)
Ouster, Inc. (CDTS)
Ouster, Inc. (AURAQ)
|
|
Industry / Sector / Ticker Info
Analyst Coverage: No
Industry Group: ELEC-MISC COMPONENTS
Sector: Computer and Technology
CUSIP: 68989M202
SIC: 3569
|
|
Fiscal Year
Fiscal Year End: December
Last Reported Quarter: 09/01/25
Next Expected EPS Date: 03/02/26
|
|
Share - Related Items
Shares Outstanding: 60.01
Most Recent Split Date: 4.00 (0.10:1)
Beta: 2.91
Market Capitalization: $1,137.10 (millions)
|
|
|
|
|
| |
| • EPS Information |
• Dividend Information |
| Analyst Coverage: No |
Dividend Yield: 0.00% |
| Current Fiscal Quarter EPS Consensus Estimate: $ |
Indicated Annual Dividend: $0.00 |
| Current Fiscal Year EPS Consensus Estimate: $-1.16 |
Payout Ratio: |
| Number of Estimates in the Fiscal Year Consensus: 2.00 |
Change In Payout Ratio: |
| Estmated Long-Term EPS Growth Rate: % |
Last Dividend Paid: NA - $0.00 |
| Next EPS Report Date: 03/02/26 |
|
|
|
| |