| Zacks Company Profile for UiPath, Inc. (PATH : NYSE) |
|
|
| |
| • Company Description |
| UiPath Inc. offers an end-to-end platform for automation, combining Robotic Process Automation solution for digital business operations. UiPath Inc. is based in New York, United States.
Number of Employees: 3,868 |
|
|
| |
| • Price / Volume Information |
| Yesterday's Closing Price: $11.04 |
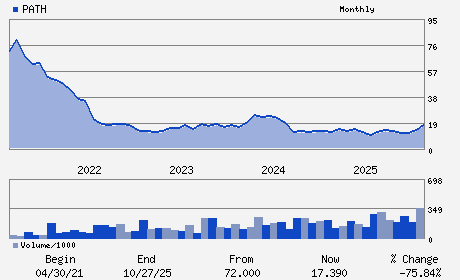
Daily Weekly Monthly
 |
| 20 Day Moving Average: 41,360,364 shares |
| Shares Outstanding: 534.75 (millions) |
| Market Capitalization: $5,903.64 (millions) |
| Beta: 1.09 |
| 52 Week High: $19.84 |
| 52 Week Low: $9.38 |
| Short Interest Ratio: |
| |
% Price Change |
% Price Change Relative to S&P 500 |
| 4 Week |
3.08% |
9.95% |
| 12 Week |
-32.64% |
-28.81% |
| Year To Date |
-32.64% |
-28.81% |
|
|
|
|
| |
|
|
| |
| • General Corporate Information |
Officers
Daniel Dines - Chief Executive Officer and Chairman
Ashim Gupta - Chief Financial Officer and Chief Operating Office
Hitesh Ramani - Chief Accounting Officer and Deputy Chief Financia
Philippe Botteri - Director
Michael Gordon - Director
|
|
Peer Information
UiPath, Inc. (ADP)
UiPath, Inc. (CWLD)
UiPath, Inc. (CYBA.)
UiPath, Inc. (ZVLO)
UiPath, Inc. (AZPN)
UiPath, Inc. (ATIS)
|
|
Industry / Sector / Ticker Info
Analyst Coverage: No
Industry Group: INTERNET SOFTWARE
Sector: Computer and Technology
CUSIP: 90364P105
SIC: 7372
|
|
Fiscal Year
Fiscal Year End: January
Last Reported Quarter: 01/01/26
Next Expected EPS Date: 06/04/26
|
|
Share - Related Items
Shares Outstanding: 534.75
Most Recent Split Date: (:1)
Beta: 1.09
Market Capitalization: $5,903.64 (millions)
|
|
|
|
|
| |
| • EPS Information |
• Dividend Information |
| Analyst Coverage: No |
Dividend Yield: 0.00% |
| Current Fiscal Quarter EPS Consensus Estimate: $0.04 |
Indicated Annual Dividend: $0.00 |
| Current Fiscal Year EPS Consensus Estimate: $0.32 |
Payout Ratio: 0.00 |
| Number of Estimates in the Fiscal Year Consensus: 6.00 |
Change In Payout Ratio: |
| Estmated Long-Term EPS Growth Rate: 19.28% |
Last Dividend Paid: NA - $0.00 |
| Next EPS Report Date: 06/04/26 |
|
|
|
| |