| Zacks Company Profile for PENN Entertainment, Inc. (PENN : NSDQ) |
|
|
| |
| • Company Description |
| PENN Entertainment Inc. is a provider of integrated entertainment, sports content and casino gaming experiences. The company's brand portfolio includes Hollywood Casino(R), L'Auberge(R), Barstool Sportsbook(R) and theScore Bet(R). PENN Entertainment Inc., formerly known as PENN Entertainment Inc., is based in WYOMISSING, Pa.
Number of Employees: 23,441 |
|
|
| |
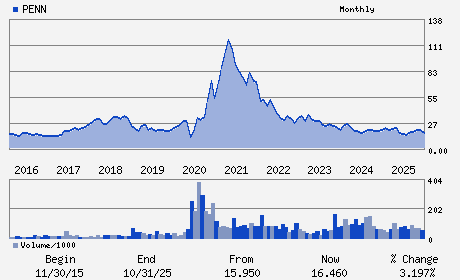
| • Price / Volume Information |
| Yesterday's Closing Price: $13.99 |
Daily Weekly Monthly
 |
| 20 Day Moving Average: 3,914,767 shares |
| Shares Outstanding: 133.55 (millions) |
| Market Capitalization: $1,868.31 (millions) |
| Beta: 1.33 |
| 52 Week High: $20.61 |
| 52 Week Low: $11.65 |
| Short Interest Ratio: |
| |
% Price Change |
% Price Change Relative to S&P 500 |
| 4 Week |
-5.79% |
2.20% |
| 12 Week |
-7.60% |
0.54% |
| Year To Date |
-5.15% |
2.35% |
|
|
|
|
| |
|
|
| |
| • General Corporate Information |
Officers
Jay A. Snowden - Chief Executive Officer; President and Director
David A. Handler - Chairman
Felicia R. Hendrix - Executive Vice President and Chief Financial Offic
Heather Ace - Director
Vimla Black-Gupta - Director
|
|
Peer Information
PENN Entertainment, Inc. (CHLD.)
PENN Entertainment, Inc. (FGRD)
PENN Entertainment, Inc. (CGMI.)
PENN Entertainment, Inc. (AGAM.)
PENN Entertainment, Inc. (ASCA.)
PENN Entertainment, Inc. (BYD)
|
|
Industry / Sector / Ticker Info
Analyst Coverage: No
Industry Group: GAMING
Sector: Consumer Discretionary
CUSIP: 707569109
SIC: 7011
|
|
Fiscal Year
Fiscal Year End: December
Last Reported Quarter: 12/01/25
Next Expected EPS Date: 05/14/26
|
|
Share - Related Items
Shares Outstanding: 133.55
Most Recent Split Date: 3.00 (2.00:1)
Beta: 1.33
Market Capitalization: $1,868.31 (millions)
|
|
|
|
|
| |
| • EPS Information |
• Dividend Information |
| Analyst Coverage: No |
Dividend Yield: 0.00% |
| Current Fiscal Quarter EPS Consensus Estimate: $0.06 |
Indicated Annual Dividend: $0.00 |
| Current Fiscal Year EPS Consensus Estimate: $1.02 |
Payout Ratio: |
| Number of Estimates in the Fiscal Year Consensus: 7.00 |
Change In Payout Ratio: |
| Estmated Long-Term EPS Growth Rate: 30.24% |
Last Dividend Paid: NA - $0.00 |
| Next EPS Report Date: 05/14/26 |
|
|
|
| |