| Zacks Company Profile for PennyMac Financial Services, Inc. (PFSI : NYSE) |
|
|
| |
| • Company Description |
| PennyMac Financial Services, Inc. provides financial services primarily in the United States. The Company conducts its business in two segments: mortgage banking and investment management. Mortgage banking segment offers correspondent and retail lending businesses and loan servicing business. Investment management segment offers investment advisory and investment management services. PennyMac Financial Services, Inc. is headquartered in Moorpark, California.
Number of Employees: 4,900 |
|
|
| |
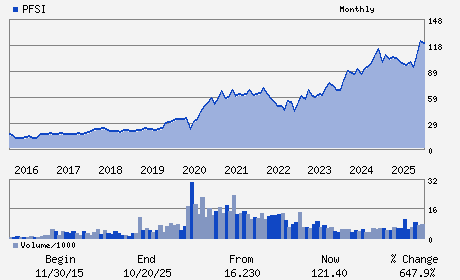
| • Price / Volume Information |
| Yesterday's Closing Price: $88.03 |
Daily Weekly Monthly
 |
| 20 Day Moving Average: 805,963 shares |
| Shares Outstanding: 52.17 (millions) |
| Market Capitalization: $4,592.33 (millions) |
| Beta: 1.56 |
| 52 Week High: $160.36 |
| 52 Week Low: $83.56 |
| Short Interest Ratio: |
| |
% Price Change |
% Price Change Relative to S&P 500 |
| 4 Week |
-6.68% |
-3.07% |
| 12 Week |
-34.30% |
-31.06% |
| Year To Date |
-33.23% |
-30.81% |
|
|
|
|
| |
|
|
| |
| • General Corporate Information |
Officers
David A. Spector - Chief Executive Officer and Chairman
Daniel S. Perotti - Chief Financial Officer
Jonathon S. Jacobson - Director
Patrick Kinsella - Director
Anne D. McCallion - Director
|
|
Peer Information
PennyMac Financial Services, Inc. (DFCLQ)
PennyMac Financial Services, Inc. (VEL)
PennyMac Financial Services, Inc. (CFC)
PennyMac Financial Services, Inc. (T.FTI)
PennyMac Financial Services, Inc. (CLNH.)
PennyMac Financial Services, Inc. (BFSC)
|
|
Industry / Sector / Ticker Info
Analyst Coverage: No
Industry Group: FIN-MTG&REL SVS
Sector: Finance
CUSIP: 70932M107
SIC: 6162
|
|
Fiscal Year
Fiscal Year End: December
Last Reported Quarter: 12/01/25
Next Expected EPS Date: 04/28/26
|
|
Share - Related Items
Shares Outstanding: 52.17
Most Recent Split Date: (:1)
Beta: 1.56
Market Capitalization: $4,592.33 (millions)
|
|
|
|
|
| |
| • EPS Information |
• Dividend Information |
| Analyst Coverage: No |
Dividend Yield: 1.36% |
| Current Fiscal Quarter EPS Consensus Estimate: $2.21 |
Indicated Annual Dividend: $1.20 |
| Current Fiscal Year EPS Consensus Estimate: $12.14 |
Payout Ratio: 0.15 |
| Number of Estimates in the Fiscal Year Consensus: 2.00 |
Change In Payout Ratio: 0.05 |
| Estmated Long-Term EPS Growth Rate: 14.39% |
Last Dividend Paid: 02/13/2026 - $0.30 |
| Next EPS Report Date: 04/28/26 |
|
|
|
| |