| Zacks Company Profile for Procter & Gamble Company (The) (PG : NYSE) |
|
|
| |
| • Company Description |
| Procter & Gamble Company, also referred to as P&G, is a branded consumer products company. The company has five reportable segments: Beauty - The segment includes hair care products antiperspirants and deodorants as well as products for personal cleansing and skin care. Grooming - The segment includes Shave Care products like female and male blades & razors and pre- and post-shave products as well as appliances. Health Care - The segment includes gastrointestinal, rapid diagnostics, respiratory, vitamins/minerals/supplements and other personal health care product categories along with toothbrush, toothpaste and other oral care, product categories. Fabric and Home Care - The segment includes air care, dish care, fabric enhancers, laundry additives and detergents, P&G Professional and surface care product categories. Baby, Feminine and Family Care - The segment includes baby wipes, diapers and pants, paper towels, tissues, toilet paper, adult incontinence and feminine care products.
Number of Employees: 109,000 |
|
|
| |
| • Price / Volume Information |
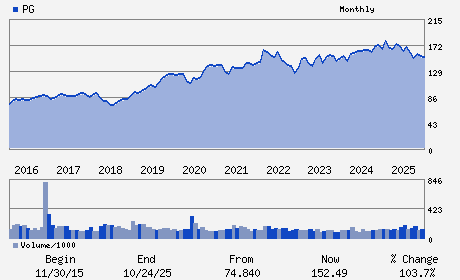
| Yesterday's Closing Price: $143.99 |
Daily Weekly Monthly
 |
| 20 Day Moving Average: 11,753,891 shares |
| Shares Outstanding: 2,324.00 (millions) |
| Market Capitalization: $334,632.88 (millions) |
| Beta: 0.37 |
| 52 Week High: $174.80 |
| 52 Week Low: $137.62 |
| Short Interest Ratio: |
| |
% Price Change |
% Price Change Relative to S&P 500 |
| 4 Week |
-12.82% |
-9.42% |
| 12 Week |
-0.40% |
4.51% |
| Year To Date |
0.47% |
4.51% |
|
|
|
|
| |
|
|
| |
| • General Corporate Information |
Officers
Jon R. Moeller - Chairman of the Board; President and Chief Executi
Andre Schulten - Chief Financial Officer
Matthew W. Janzaruk - Senior Vice President
B. Marc Allen - Director
Craig Arnold - Director
|
|
Peer Information
Procter & Gamble Company (The) (EPC)
Procter & Gamble Company (The) (HPPS)
Procter & Gamble Company (The) (ADRNY)
Procter & Gamble Company (The) (YHGJ)
Procter & Gamble Company (The) (GPSYY)
Procter & Gamble Company (The) (HENKY)
|
|
Industry / Sector / Ticker Info
Analyst Coverage: No
Industry Group: CONS PD- MISC STPL
Sector: Consumer Staples
CUSIP: 742718109
SIC: 2840
|
|
Fiscal Year
Fiscal Year End: June
Last Reported Quarter: 12/01/25
Next Expected EPS Date: 04/23/26
|
|
Share - Related Items
Shares Outstanding: 2,324.00
Most Recent Split Date: 6.00 (2.00:1)
Beta: 0.37
Market Capitalization: $334,632.88 (millions)
|
|
|
|
|
| |
| • EPS Information |
• Dividend Information |
| Analyst Coverage: No |
Dividend Yield: 2.94% |
| Current Fiscal Quarter EPS Consensus Estimate: $1.57 |
Indicated Annual Dividend: $4.23 |
| Current Fiscal Year EPS Consensus Estimate: $6.97 |
Payout Ratio: 0.61 |
| Number of Estimates in the Fiscal Year Consensus: 12.00 |
Change In Payout Ratio: 0.00 |
| Estmated Long-Term EPS Growth Rate: 4.29% |
Last Dividend Paid: 01/23/2026 - $1.06 |
| Next EPS Report Date: 04/23/26 |
|
|
|
| |