| Zacks Company Profile for Precigen, Inc. (PGEN : NSDQ) |
|
|
| |
| • Company Description |
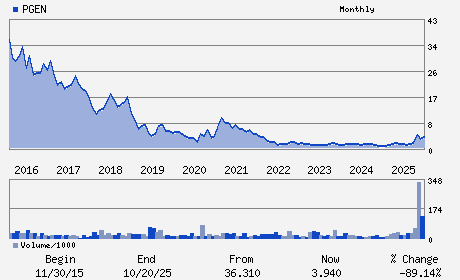
| Precigen Inc. is a biopharmaceutical company. It specialise in the development of gene and cell therapies for immuno-oncology, autoimmune disorders and infectious diseases. The company's transformative therapeutic platforms, including UltraCAR-T(TM), AdenoVerse(TM) cytokine therapies, multifunctional therapeutics and off-the-shelf AdenoVerse(TM) immunotherapies, as well as ActoBio Therapeutics, Exemplar Genetics and Triple-Gene from our subsidiaries. Precigen Inc., formerly known as Intrexon Corporation, is based in Germantown, Maryland.
Number of Employees: 143 |
|
|
| |
| • Price / Volume Information |
| Yesterday's Closing Price: $3.28 |
Daily Weekly Monthly
 |
| 20 Day Moving Average: 4,180,112 shares |
| Shares Outstanding: 353.83 (millions) |
| Market Capitalization: $1,160.55 (millions) |
| Beta: 1.10 |
| 52 Week High: $5.47 |
| 52 Week Low: $1.11 |
| Short Interest Ratio: |
| |
% Price Change |
% Price Change Relative to S&P 500 |
| 4 Week |
-27.27% |
-23.30% |
| 12 Week |
-21.72% |
-16.60% |
| Year To Date |
-21.53% |
-17.70% |
|
|
|
|
| |
|
|
| |
| • General Corporate Information |
Officers
Helen Sabzevari - Chief Executive Officer
Randal J. Kirk - Executive Chairman
Harry Thomasian Jr. - Chief Financial Officer
Nancy H. Agee - Director
Cesar L. Alvarez - Director
|
|
Peer Information
Precigen, Inc. (CORR.)
Precigen, Inc. (RSPI)
Precigen, Inc. (CGXP)
Precigen, Inc. (BGEN)
Precigen, Inc. (GTBP)
Precigen, Inc. (RGRX)
|
|
Industry / Sector / Ticker Info
Analyst Coverage: No
Industry Group: MED-BIOMED/GENE
Sector: Medical
CUSIP: 74017N105
SIC: 2834
|
|
Fiscal Year
Fiscal Year End: December
Last Reported Quarter: 09/01/25
Next Expected EPS Date: 03/25/26
|
|
Share - Related Items
Shares Outstanding: 353.83
Most Recent Split Date: (:1)
Beta: 1.10
Market Capitalization: $1,160.55 (millions)
|
|
|
|
|
| |
| • EPS Information |
• Dividend Information |
| Analyst Coverage: No |
Dividend Yield: 0.00% |
| Current Fiscal Quarter EPS Consensus Estimate: $-0.08 |
Indicated Annual Dividend: $0.00 |
| Current Fiscal Year EPS Consensus Estimate: $-0.16 |
Payout Ratio: |
| Number of Estimates in the Fiscal Year Consensus: 2.00 |
Change In Payout Ratio: |
| Estmated Long-Term EPS Growth Rate: % |
Last Dividend Paid: NA - $0.00 |
| Next EPS Report Date: 03/25/26 |
|
|
|
| |