| Zacks Company Profile for Dave & Buster's Entertainment, Inc. (PLAY : NSDQ) |
|
|
| |
| • Company Description |
| Dave & Buster's Entertainment, is a leading owner and operator of high-volume venues in North America that combine dining and entertainment for both adults and families. The core concept of this restaurant chain is 'Eat Drink Play and Watch', all in one location. Under the Eat concept, the company offers a wide variety of starters, burgers, choice-grade steaks and health-conscious food. The company operates under two segments, Food and Beverage and Amusement and Other revenues.Coming to the Drink concept, the company's locations offer full bar service, including a variety of beers, hand-crafted cocktails and premium spirits. Dave & Buster's has re-crafted recipes, switched to more fresh juices and purees, and house-made mixers. Under the Play concept, the company has a distinguished entertainment experience, some of which are exclusive to Dave & Buster's on a permanent or temporary basis.
Number of Employees: 23,420 |
|
|
| |
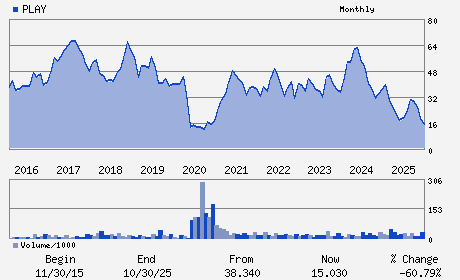
| • Price / Volume Information |
| Yesterday's Closing Price: $9.81 |
Daily Weekly Monthly
 |
| 20 Day Moving Average: 1,680,395 shares |
| Shares Outstanding: 34.68 (millions) |
| Market Capitalization: $340.21 (millions) |
| Beta: 1.79 |
| 52 Week High: $35.53 |
| 52 Week Low: $9.61 |
| Short Interest Ratio: |
| |
% Price Change |
% Price Change Relative to S&P 500 |
| 4 Week |
-33.36% |
-28.02% |
| 12 Week |
-42.43% |
-38.00% |
| Year To Date |
-39.48% |
-34.95% |
|
|
|
|
| |
|
|
| |
| • General Corporate Information |
Officers
Kevin Sheehan - Chief Executive Officer and Director
Darin Harper - Chief Financial Officer
Michael J. Griffith - Director
James Chambers - Director
Hamish A. Dodds - Director
|
|
Peer Information
Dave & Buster's Entertainment, Inc. (BH)
Dave & Buster's Entertainment, Inc. (BUCA)
Dave & Buster's Entertainment, Inc. (BUNZQ)
Dave & Buster's Entertainment, Inc. (FRRG)
Dave & Buster's Entertainment, Inc. (CHEF.)
Dave & Buster's Entertainment, Inc. (BGMTQ)
|
|
Industry / Sector / Ticker Info
Analyst Coverage: No
Industry Group: RETAIL-RESTRNTS
Sector: Retail/Wholesale
CUSIP: 238337109
SIC: 5812
|
|
Fiscal Year
Fiscal Year End: January
Last Reported Quarter: 10/01/25
Next Expected EPS Date: 03/31/26
|
|
Share - Related Items
Shares Outstanding: 34.68
Most Recent Split Date: (:1)
Beta: 1.79
Market Capitalization: $340.21 (millions)
|
|
|
|
|
| |
| • EPS Information |
• Dividend Information |
| Analyst Coverage: No |
Dividend Yield: 0.00% |
| Current Fiscal Quarter EPS Consensus Estimate: $0.74 |
Indicated Annual Dividend: $0.00 |
| Current Fiscal Year EPS Consensus Estimate: $0.47 |
Payout Ratio: 0.00 |
| Number of Estimates in the Fiscal Year Consensus: 3.00 |
Change In Payout Ratio: 0.00 |
| Estmated Long-Term EPS Growth Rate: % |
Last Dividend Paid: NA - $0.00 |
| Next EPS Report Date: 03/31/26 |
|
|
|
| |