| Zacks Company Profile for PriceSmart, Inc. (PSMT : NSDQ) |
|
|
| |
| • Company Description |
| PriceSmart, Inc. is primarily engaged in the operation of membership shopping warehouses in international markets. The company's business consists of international membership shopping stores similar to, but smaller in size than, warehouse clubs in the United States. The warehouses sell basic consumer goods with an emphasis on quality, low prices and efficient operations. By offering low prices on brand name and private label merchandise, the warehouses seek to generate sufficient sales volumes to operate profitably at relatively low gross margins.
Number of Employees: 12,000 |
|
|
| |
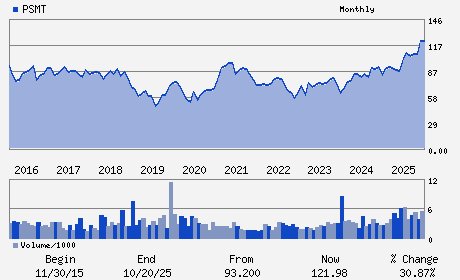
| • Price / Volume Information |
| Yesterday's Closing Price: $140.70 |
Daily Weekly Monthly
 |
| 20 Day Moving Average: 222,089 shares |
| Shares Outstanding: 30.82 (millions) |
| Market Capitalization: $4,335.73 (millions) |
| Beta: 0.73 |
| 52 Week High: $158.00 |
| 52 Week Low: $81.35 |
| Short Interest Ratio: |
| |
% Price Change |
% Price Change Relative to S&P 500 |
| 4 Week |
-8.48% |
-2.81% |
| 12 Week |
12.60% |
19.93% |
| Year To Date |
14.70% |
20.67% |
|
|
|
|
| |
|
|
| |
| • General Corporate Information |
Officers
David N. Price - Chief Executive Officer and Director
Robert E. Price - Executive Chairman
David R. Snyder - Vice Chairman
Gualberto Hernandez - Executive Vice President and Chief Financial Offic
Sherry S. Bahrambeygui - Director
|
|
Peer Information
PriceSmart, Inc. (TGT)
PriceSmart, Inc. (BURL)
PriceSmart, Inc. (ALCSQ)
PriceSmart, Inc. (CLDRQ)
PriceSmart, Inc. (BLEEQ)
PriceSmart, Inc. (FDO)
|
|
Industry / Sector / Ticker Info
Analyst Coverage: No
Industry Group: RETAIL-DISCOUNT
Sector: Retail/Wholesale
CUSIP: 741511109
SIC: 5331
|
|
Fiscal Year
Fiscal Year End: August
Last Reported Quarter: 11/01/25
Next Expected EPS Date: 04/08/26
|
|
Share - Related Items
Shares Outstanding: 30.82
Most Recent Split Date: (:1)
Beta: 0.73
Market Capitalization: $4,335.73 (millions)
|
|
|
|
|
| |
| • EPS Information |
• Dividend Information |
| Analyst Coverage: No |
Dividend Yield: 1.00% |
| Current Fiscal Quarter EPS Consensus Estimate: $ |
Indicated Annual Dividend: $1.40 |
| Current Fiscal Year EPS Consensus Estimate: $ |
Payout Ratio: 0.26 |
| Number of Estimates in the Fiscal Year Consensus: |
Change In Payout Ratio: 0.01 |
| Estmated Long-Term EPS Growth Rate: % |
Last Dividend Paid: 02/17/2026 - $0.70 |
| Next EPS Report Date: 04/08/26 |
|
|
|
| |