| Zacks Company Profile for Patterson-UTI Energy, Inc. (PTEN : NSDQ) |
|
|
| |
| • Company Description |
| Patterson-UTI Energy, Inc. is an oilfield services company. It is one of the largest onshore contract drillers in the United States and has a large fleet of pressure pumping equipment. Patterson-UTI operates primarily in four segments: Contract Drilling , Pressure Pumping, Directional Drilling, and Others. The company is a major supplier of onshore drilling rigs on a contractual basis to explore for and develop oil and gas.
Number of Employees: 7,900 |
|
|
| |
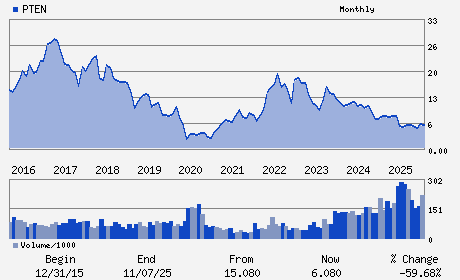
| • Price / Volume Information |
| Yesterday's Closing Price: $10.81 |
Daily Weekly Monthly
 |
| 20 Day Moving Average: 10,427,563 shares |
| Shares Outstanding: 379.62 (millions) |
| Market Capitalization: $4,103.65 (millions) |
| Beta: 0.57 |
| 52 Week High: $11.75 |
| 52 Week Low: $5.10 |
| Short Interest Ratio: |
| |
% Price Change |
% Price Change Relative to S&P 500 |
| 4 Week |
-1.10% |
-8.66% |
| 12 Week |
47.48% |
44.17% |
| Year To Date |
76.92% |
69.68% |
|
|
|
|
| |
|
|
| |
| • General Corporate Information |
Officers
William Andrew Hendricks - Chief Executive Officer;President
Curtis W. Huff - Chairman of the Board
Robert W. Drummond - Vice Chairman of the Board
C. Andrew Smith - Chief Financial Officer;Executive Vice President
Forrest Robinson - Chief Accounting Officer
|
|
Peer Information
Patterson-UTI Energy, Inc. (DOFSQ)
Patterson-UTI Energy, Inc. (NBR)
Patterson-UTI Energy, Inc. (OKOK)
Patterson-UTI Energy, Inc. (PMESY)
Patterson-UTI Energy, Inc. (GW)
Patterson-UTI Energy, Inc. (GLM)
|
|
Industry / Sector / Ticker Info
Analyst Coverage: No
Industry Group: OIL&GAS-DRILL
Sector: Oils/Energy
CUSIP: 703481101
SIC: 1381
|
|
Fiscal Year
Fiscal Year End: December
Last Reported Quarter: 03/01/26
Next Expected EPS Date: 07/22/26
|
|
Share - Related Items
Shares Outstanding: 379.62
Most Recent Split Date: 7.00 (2.00:1)
Beta: 0.57
Market Capitalization: $4,103.65 (millions)
|
|
|
|
|
| |
| • EPS Information |
• Dividend Information |
| Analyst Coverage: No |
Dividend Yield: 3.70% |
| Current Fiscal Quarter EPS Consensus Estimate: $-0.08 |
Indicated Annual Dividend: $0.40 |
| Current Fiscal Year EPS Consensus Estimate: $-0.31 |
Payout Ratio: |
| Number of Estimates in the Fiscal Year Consensus: 8.00 |
Change In Payout Ratio: |
| Estmated Long-Term EPS Growth Rate: % |
Last Dividend Paid: 03/02/2026 - $0.10 |
| Next EPS Report Date: 07/22/26 |
|
|
|
| |