| Zacks Company Profile for Pulmatrix, Inc. (PULM : NSDQ) |
|
|
| |
| • Company Description |
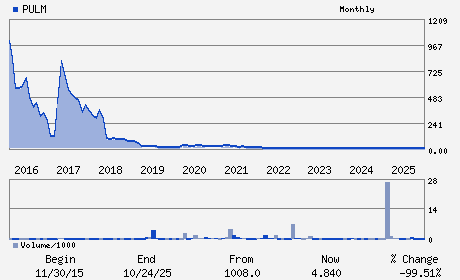
| Pulmatrix, Inc. is a biopharmaceutical company which is engaged in developing inhaled therapies for serious pulmonary disease. The Company's proprietary product pipeline includes PUR1900, an inhaled anti-fungal for cystic fibrosis, PUR0200, a branded generic for chronic obstructive pulmonary disease which are in different clinical stage. Its technology platform consists of iSPERSE. Pulmatrix, Inc., formerly known as Ruthigen, Inc., is based in Lexington, MA.
Number of Employees: 2 |
|
|
| |
| • Price / Volume Information |
| Yesterday's Closing Price: $2.15 |
Daily Weekly Monthly
 |
| 20 Day Moving Average: 56,304 shares |
| Shares Outstanding: 3.65 (millions) |
| Market Capitalization: $7.85 (millions) |
| Beta: 1.68 |
| 52 Week High: $9.37 |
| 52 Week Low: $1.63 |
| Short Interest Ratio: |
| |
% Price Change |
% Price Change Relative to S&P 500 |
| 4 Week |
-35.44% |
-32.15% |
| 12 Week |
-1.38% |
3.74% |
| Year To Date |
-3.59% |
0.66% |
|
|
|
|
| |
|
|
| |
| • General Corporate Information |
Officers
Peter Ludlum - Interim Chief Executive Officer and Interim Chief
Michael J. Higgins - Chairman
Richard Batycky - Director
Todd Bazemore - Director
Christopher Cabell - Director
|
|
Peer Information
Pulmatrix, Inc. (CORR.)
Pulmatrix, Inc. (RSPI)
Pulmatrix, Inc. (CGXP)
Pulmatrix, Inc. (BGEN)
Pulmatrix, Inc. (GTBP)
Pulmatrix, Inc. (RGRX)
|
|
Industry / Sector / Ticker Info
Analyst Coverage: No
Industry Group: MED-BIOMED/GENE
Sector: Medical
CUSIP: 74584P301
SIC: 2834
|
|
Fiscal Year
Fiscal Year End: December
Last Reported Quarter: 12/01/25
Next Expected EPS Date: 05/21/26
|
|
Share - Related Items
Shares Outstanding: 3.65
Most Recent Split Date: 3.00 (0.05:1)
Beta: 1.68
Market Capitalization: $7.85 (millions)
|
|
|
|
|
| |
| • EPS Information |
• Dividend Information |
| Analyst Coverage: No |
Dividend Yield: 0.00% |
| Current Fiscal Quarter EPS Consensus Estimate: $ |
Indicated Annual Dividend: $0.00 |
| Current Fiscal Year EPS Consensus Estimate: $ |
Payout Ratio: |
| Number of Estimates in the Fiscal Year Consensus: |
Change In Payout Ratio: |
| Estmated Long-Term EPS Growth Rate: % |
Last Dividend Paid: NA - $0.00 |
| Next EPS Report Date: 05/21/26 |
|
|
|
| |