| Zacks Company Profile for Q2 Holdings, Inc. (QTWO : NYSE) |
|
|
| |
| • Company Description |
| Q2 Holdings, Inc. provides secure, cloud-based virtual banking solutions. The Company's solutions include Q2online, Q2themes, Q2mobility App, Q2mobile Remote Deposit Capture, Q2text, Q2voice, Q2clarity and Q2 Risk & Fraud Analytics. It enables regional and community financial institutions, or RCFIs, to deliver a suite of integrated virtual banking services. Q2 Holdings, Inc. is headquartered in Austin, Texas.
Number of Employees: 2,549 |
|
|
| |
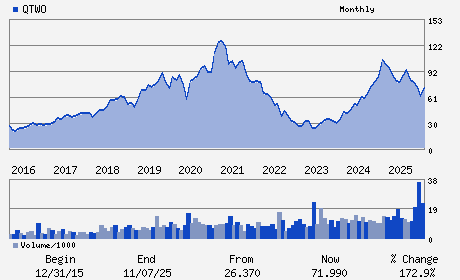
| • Price / Volume Information |
| Yesterday's Closing Price: $50.24 |
Daily Weekly Monthly
 |
| 20 Day Moving Average: 1,406,121 shares |
| Shares Outstanding: 62.40 (millions) |
| Market Capitalization: $3,135.20 (millions) |
| Beta: 1.40 |
| 52 Week High: $96.68 |
| 52 Week Low: $46.16 |
| Short Interest Ratio: |
| |
% Price Change |
% Price Change Relative to S&P 500 |
| 4 Week |
-16.96% |
-15.81% |
| 12 Week |
-31.65% |
-32.00% |
| Year To Date |
-30.38% |
-30.74% |
|
|
|
|
| |
|
|
| |
| • General Corporate Information |
Officers
Matthew P. Flake - Chief Executive Officer and Chairman
Jonathan A. Price - Chief Financial Officer
R. Lynn Atchison - Director
Andre L. Mintz - Director
Lynn A. Tyson - Director
|
|
Peer Information
Q2 Holdings, Inc. (ADP)
Q2 Holdings, Inc. (CWLD)
Q2 Holdings, Inc. (CYBA.)
Q2 Holdings, Inc. (ZVLO)
Q2 Holdings, Inc. (AZPN)
Q2 Holdings, Inc. (ATIS)
|
|
Industry / Sector / Ticker Info
Analyst Coverage: No
Industry Group: INTERNET SOFTWARE
Sector: Computer and Technology
CUSIP: 74736L109
SIC: 7372
|
|
Fiscal Year
Fiscal Year End: December
Last Reported Quarter: 12/01/25
Next Expected EPS Date: 05/06/26
|
|
Share - Related Items
Shares Outstanding: 62.40
Most Recent Split Date: (:1)
Beta: 1.40
Market Capitalization: $3,135.20 (millions)
|
|
|
|
|
| |
| • EPS Information |
• Dividend Information |
| Analyst Coverage: No |
Dividend Yield: 0.00% |
| Current Fiscal Quarter EPS Consensus Estimate: $0.38 |
Indicated Annual Dividend: $0.00 |
| Current Fiscal Year EPS Consensus Estimate: $1.56 |
Payout Ratio: 0.00 |
| Number of Estimates in the Fiscal Year Consensus: 5.00 |
Change In Payout Ratio: |
| Estmated Long-Term EPS Growth Rate: % |
Last Dividend Paid: NA - $0.00 |
| Next EPS Report Date: 05/06/26 |
|
|
|
| |