| Zacks Company Profile for LiveRamp Holdings, Inc. (RAMP : NYSE) |
|
|
| |
| • Company Description |
| LiveRamp Holdings, Inc. operates as a marketing technology company. It provides data foundation, digital transformation, consumer engagement, and online marketing and analysis services. LiveRamp Holdings Inc., formerly known as Acxiom Holdings, is based in AR, United States.
Number of Employees: 1,300 |
|
|
| |
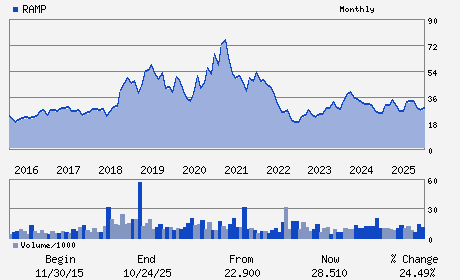
| • Price / Volume Information |
| Yesterday's Closing Price: $25.83 |
Daily Weekly Monthly
 |
| 20 Day Moving Average: 912,229 shares |
| Shares Outstanding: 63.12 (millions) |
| Market Capitalization: $1,630.52 (millions) |
| Beta: 1.12 |
| 52 Week High: $35.20 |
| 52 Week Low: $21.71 |
| Short Interest Ratio: |
| |
% Price Change |
% Price Change Relative to S&P 500 |
| 4 Week |
-0.04% |
5.05% |
| 12 Week |
-13.32% |
-8.83% |
| Year To Date |
-12.05% |
-8.17% |
|
|
|
|
| |
|
|
| |
| • General Corporate Information |
Officers
Scott E. Howe - Chief Executive Officer
Clark M. Kokich - Chairman
Lauren Dillard - Vice President and Chief Financial Officer
John L. Battelle - Director
Timothy R. Cadogan - Director
|
|
Peer Information
LiveRamp Holdings, Inc. (EVOL)
LiveRamp Holdings, Inc. (RAMP)
LiveRamp Holdings, Inc. (LGTY)
LiveRamp Holdings, Inc. (ALOT)
LiveRamp Holdings, Inc. (CXT)
LiveRamp Holdings, Inc. (TGHI)
|
|
Industry / Sector / Ticker Info
Analyst Coverage: No
Industry Group: Technology Services
Sector: Business Services
CUSIP: 53815P108
SIC: 7374
|
|
Fiscal Year
Fiscal Year End: March
Last Reported Quarter: 12/01/25
Next Expected EPS Date: 05/20/26
|
|
Share - Related Items
Shares Outstanding: 63.12
Most Recent Split Date: 11.00 (2.00:1)
Beta: 1.12
Market Capitalization: $1,630.52 (millions)
|
|
|
|
|
| |
| • EPS Information |
• Dividend Information |
| Analyst Coverage: No |
Dividend Yield: 0.00% |
| Current Fiscal Quarter EPS Consensus Estimate: $0.29 |
Indicated Annual Dividend: $0.00 |
| Current Fiscal Year EPS Consensus Estimate: $1.30 |
Payout Ratio: 0.00 |
| Number of Estimates in the Fiscal Year Consensus: 1.00 |
Change In Payout Ratio: 0.00 |
| Estmated Long-Term EPS Growth Rate: % |
Last Dividend Paid: NA - $0.00 |
| Next EPS Report Date: 05/20/26 |
|
|
|
| |