| Zacks Company Profile for RadNet, Inc. (RDNT : NSDQ) |
|
|
| |
| • Company Description |
| RadNet, Inc., is a national market leader providing high-quality, cost-effective diagnostic imaging services through a network of fully-owned and operated outpatient imaging centers. RadNet offers to its patients and referring physicians the full spectrum of diagnostic imaging exams, including PET/CT, MRI, CT, Nuclear Medicine, Mammography, Ultrasound and X-ray, as well as numerous other procedures. RadNet utilizes best of breed technology to appropriately serve the medical communities in which it operates.
Number of Employees: 11,264 |
|
|
| |
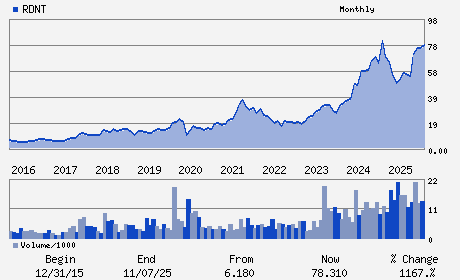
| • Price / Volume Information |
| Yesterday's Closing Price: $57.63 |
Daily Weekly Monthly
 |
| 20 Day Moving Average: 724,758 shares |
| Shares Outstanding: 78.27 (millions) |
| Market Capitalization: $4,510.79 (millions) |
| Beta: 1.53 |
| 52 Week High: $85.84 |
| 52 Week Low: $49.83 |
| Short Interest Ratio: |
| |
% Price Change |
% Price Change Relative to S&P 500 |
| 4 Week |
2.64% |
-8.77% |
| 12 Week |
-17.79% |
-20.38% |
| Year To Date |
-19.23% |
-22.83% |
|
|
|
|
| |
|
|
| |
| • General Corporate Information |
Officers
Howard G. Berger - Chief Executive Officer and President
Mark D. Stolper - Chief Financial Officer
Gregory E. Spurlock - Director
Alma Gregory Sorensen - Director
David L. Swartz - Director
|
|
Peer Information
RadNet, Inc. (CMTI)
RadNet, Inc. (CMWLQ)
RadNet, Inc. (AHG.)
RadNet, Inc. (ROIX)
RadNet, Inc. (M.DCE)
RadNet, Inc. (DHSM)
|
|
Industry / Sector / Ticker Info
Analyst Coverage: No
Industry Group: MED-OUTP/HM CRE
Sector: Medical
CUSIP: 750491102
SIC: 8071
|
|
Fiscal Year
Fiscal Year End: December
Last Reported Quarter: 12/01/25
Next Expected EPS Date: 05/11/26
|
|
Share - Related Items
Shares Outstanding: 78.27
Most Recent Split Date: (:1)
Beta: 1.53
Market Capitalization: $4,510.79 (millions)
|
|
|
|
|
| |
| • EPS Information |
• Dividend Information |
| Analyst Coverage: No |
Dividend Yield: 0.00% |
| Current Fiscal Quarter EPS Consensus Estimate: $0.23 |
Indicated Annual Dividend: $0.00 |
| Current Fiscal Year EPS Consensus Estimate: $0.67 |
Payout Ratio: 0.00 |
| Number of Estimates in the Fiscal Year Consensus: 3.00 |
Change In Payout Ratio: 0.00 |
| Estmated Long-Term EPS Growth Rate: % |
Last Dividend Paid: NA - $0.00 |
| Next EPS Report Date: 05/11/26 |
|
|
|
| |