| Zacks Company Profile for RELX PLC (RELX : NYSE) |
|
|
| |
| • Company Description |
| Relx PLC is engaged in providing information solutions. Its products and services comprise intellectual property content delivered through various media, including online, journals and books. The Company's operating segments consists of Scientific, Technical & Medical, Risk & Business Information; Legal and Exhibitions. RELX PLC, formerly known as Reed Elsevier PLC, is based in LONDON, United Kingdom.
Number of Employees: 37,000 |
|
|
| |
| • Price / Volume Information |
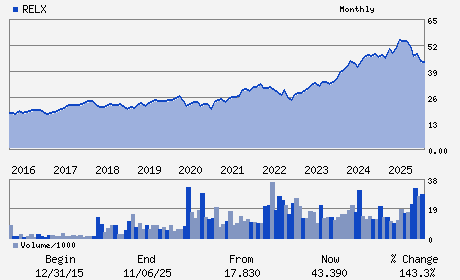
| Yesterday's Closing Price: $33.36 |
Daily Weekly Monthly
 |
| 20 Day Moving Average: 3,441,757 shares |
| Shares Outstanding: 1,804.93 (millions) |
| Market Capitalization: $60,212.38 (millions) |
| Beta: 0.77 |
| 52 Week High: $56.33 |
| 52 Week Low: $27.57 |
| Short Interest Ratio: |
| |
% Price Change |
% Price Change Relative to S&P 500 |
| 4 Week |
-5.20% |
-2.84% |
| 12 Week |
-20.93% |
-16.78% |
| Year To Date |
-17.47% |
-14.61% |
|
|
|
|
| |
|
|
| |
| • General Corporate Information |
Officers
Erik Engstrom - Chief Executive Officer
Paul Walker - Chairman
Nick Luff - Chief Financial Officer
Alistair Cox - Director
Andrew Sukawaty - Director
|
|
Peer Information
RELX PLC (HHNT)
RELX PLC (CDCAQ)
RELX PLC (IPIXQ)
RELX PLC (CNET.)
RELX PLC (DTHK)
RELX PLC (ADAM.)
|
|
Industry / Sector / Ticker Info
Analyst Coverage: No
Industry Group: INTERNET CONTENT
Sector: Computer and Technology
CUSIP: 759530108
SIC: 7389
|
|
Fiscal Year
Fiscal Year End: December
Last Reported Quarter: -
Next Expected EPS Date: -
|
|
Share - Related Items
Shares Outstanding: 1,804.93
Most Recent Split Date: 7.00 (4.00:1)
Beta: 0.77
Market Capitalization: $60,212.38 (millions)
|
|
|
|
|
| |
| • EPS Information |
• Dividend Information |
| Analyst Coverage: No |
Dividend Yield: 1.58% |
| Current Fiscal Quarter EPS Consensus Estimate: $ |
Indicated Annual Dividend: $0.53 |
| Current Fiscal Year EPS Consensus Estimate: $1.89 |
Payout Ratio: |
| Number of Estimates in the Fiscal Year Consensus: 2.00 |
Change In Payout Ratio: |
| Estmated Long-Term EPS Growth Rate: 9.82% |
Last Dividend Paid: NA - $0.00 |
| Next EPS Report Date: - |
|
|
|
| |